Showing posts with label US-Stocks. Show all posts

Thursday, August 14, 2025

Putin-Trump Meeting to Be Followed by Market Panic Cycle | Martin Armstrong

The Putin-Trump meeting on Friday, August 15th, in Alaska preludes Martin Armstrong's forecasted Panic Cycle.  

 The Dow Jones Industrial Average Weekly Timing Array of August 4, 2025, 
highlights a Panic Cycle during the week of August 18-22.

The Panic Cycle becomes active during the week of August 18-22 and, according to Armstrong Economics, will be a period of extreme volatility that often triggers outside reversals of weekly, daily, and session ranges, projecting forceful directional moves.
 

Wednesday, August 13, 2025

Buffett Indicator Hits All-Time High with Market Cap-to-GDP Ratio at 212.1%

As of August 12, 2025, the Warren Buffett Indicator has surged past 212%, marking its highest level on record.

 US market cap twice US GDP.
 
 
US debt hits $37T — surpasses entire $31T US GDP, 
matches combined GDP of China, Germany, Japan, India & UK.
 
The Buffett Indicator, or Market Cap-to-GDP ratio, rose to prominence as a long-term stock valuation metric following Warren Buffett’s 2001 'Fortune' interview, where he called it "probably the best single measure of where valuations stand at any given moment." 

The 2000 dot-com bust and the 2007 crash may seem mild by comparison.
 
The ratio compares US public market cap to GDP using the Wilshire 5000 Index, covering nearly the entire stock market.

Tuesday, August 12, 2025

Hurst Cycles Update for S&P 500, NASDAQ, Gold & Bitcoin | David Hickson

S&P 500: Phased with an 18-month (or larger) trough in early April, 80-day trough mid-June (debated position due to fundamentals), 40-day trough mid-July, and recent subtle troughs suggesting a distorted 20-week cycle influenced by bullish longer cycles. Alternative analysis considers 20-week trough possibly formed on August 1st, but preferred view is it's ahead.
 
S&P 500 (daily bars) and Composite Model (dashed orange line).

Watch price interaction with 20-day FLD: support indicates 20-week trough has formed; crossing below suggests trough ahead. Bullish trend distorts cycles upward, with early trough possible within whiskers (mid-August range). Preferred: 20-week trough late August/early September, after a potential short bounce and decline. If trough formed early, expect upside to FLD-generated targets; composite model shows possible downturn soon.
 

NASDAQ: Similar to S&P 500, with 18-month trough April 7th, 80-day trough slightly late (77 days, mid-June), 40-day trough August 1st (39 days, running long). Cycles averaging longer wavelengths; good match to price troughs.
 
NASDAQ (daily bars) and Composite Model (dashed orange line).

Monitor shorter cycles for shortening (e.g., 20-day at 13 days, 40-day at 28 days) as indicator of trend change. Bullish trend may push peaks higher/later. 20-week trough ahead (end August/early September), with potential bounce to lower/higher peak, then decline. Composite model suggests lower peak but bullishness could override; cycles likely continue long unless shorter ones shorten.
 

Gold: Sideways in wedge, testing $3,450 peak multiple times; synchronized peaks expected. Dual trough/peak analyses both valid: 40-week trough mid-May, 80-day trough July 30th (post-update), good FLD interactions (66.7% rating).

Gold (daily bars) and Composite Model (dashed orange line).
 
Trapped wedge suggests breakout imminent; combine trough/peak for composite. Higher peak at 20-week cycle (end August/early September), then potential upside continuation. Composite (dual) shows upward move post-20-day trough; expect FLD support.
 

Bitcoin: 40-week trough mid-April, 80-day trough late June (clear), 40-day trough late (August 1st, expanded shorter cycles). Pure rhythms; similar to stocks, with bullish distortion.

Bitcoin (daily bars) and Composite Model (dashed orange line).
 
Watch 20-day FLD: support indicates early 20-week trough; cross below confirms ahead. Excessive bullishness (possible larger trough in April) pushes amplitudes higher. 20-week trough ahead (end August/early September), after bounce to potentially higher peak despite model showing lower. Cycles running long; amplitude least reliable, but wavelengths suggest decline post-peak.


Tuesday, August 5, 2025

S&P 500 20-Week Hurst Cycle Support Around 6,000 | Branimir Vojcic

The S&P 500, having bounced off support, is projected by Hurst Cycle Analysis to reverse near its current level and decline into a 20-week cycle low around the third week of August, likely finding support around 6,000 (+/- 50) at the 20-week Forward Line of Demarcation (FLD). 


April 7, 2025, was an 18-month cycle low, and the next 40-week cycle (= 9-month cycle) troughs are estimated for early 2026 and late Q4 2026.


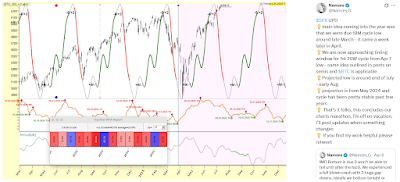
The Hurst Cycle Composite line for the Nasdaq 100 4-hour chart (orange) predicts a mid-August trough, a peak around late September 2025, and a subsequent decline.
 
Reference:

Saturday, August 2, 2025

17-0 Turn-of-Year S&P 500 Setup with 7.1% Average Gain | Wayne Whaley

After the 20% pullback in the S&P 500 that occurred from February 19 to April 8, May, June, and July each posted positive returns of 6.2%, 5.0%, and 2.1%, respectively. In the 75 years following 1950, there have only been 17 instances in which the traditional "Sell in May and Go Away" period was marked by three consecutive positive months (May, June, and July): 

 From October 12 to October 27, the performance was 2 wins to 15 losses, with an average loss of 3.0%.
From October 27 to January 18, the record was 17-0, with an average gain of 7.1%.
 
Looking at the following 12 months, from August through July, the outcome was favorable, with a record of 14 wins and 3 losses in this setup. The average gain over this period was 12.6%, compared to a more typical yearly gain of 9.5%.

Interestingly, the only negative month during the following year was October. Specifically, from October 12 to October 27, the performance was 2 wins to 15 losses, with an average loss of 3.0%. However, from October 27 to January 18, the trend reversed dramatically, posting a perfect 17-0 record with an average gain of 7.1% over 11.7 weeks.

S&P 500 Hurst Cycles Update: Mid-August Low, Rally into September | Krasi

As expected, last week, the completion of minor Elliott Waves 4 and 5 led to a bearish weekly reversal, confirming the pattern on schedule and initiating a downward move. We are currently in week 17 of the 20-week cycle, with the cycle low expected within the next 1–3 weeks, likely mid-August, followed by an upward move into September.
 

Key upcoming milestones include a 40-week low in November or December 2025 and a 40-week high in February or March 2026. Market reversals typically occur gradually rather than with abrupt crashes. Thus, between now and February/March 2026, anticipate a series of highs and lows. After this period, the market is likely to experience a more pronounced decline. For historical parallels, examine the periods of January–August 2000, May–December 2007, and August 2021–March 2022. 

Monday, July 28, 2025

S&P 500 and NASDAQ Close to 40-Day Hurst Cycle Peak | David Hickson

The S&P 500 formed an 18-month cycle trough in early April 2025, followed by an 80-day cycle trough on June 23, and a recent 40-day cycle trough on July 16. A 20-week cycle trough is anticipated around mid-August, with the 20-week cycle FLD expected to provide support. 
 
S&P 500 (daily bars): Expect a 40-day cycle peak soon, and a mid-August 20-week cycle trough.

The market is currently in a bullish trend, forming a second 40-day cycle peak soon, after which it should decline into the 20-week trough. Shorter cycle FLDs (5-day, 10-day, 20-day, 40-day, 80-day) will be monitored for peak confirmation and to generate downside targets. The trough may form above the 20-week FLD due to the bullish trend.

The NASDAQ also formed an 18-month cycle trough in the April, and an 80-day cycle trough in mid-June. A second 40-day cycle peak is expected soon, followed by a decline into a 20-week cycle trough in mid-August, with support at the 20-week FLD.
 
 NASDAQ (daily bars), same as in the S&P: 40-day cycle peak soon, 
and a rather shallow mid-August 20-week cycle trough.

Shorter cycle FLDs will be watched for peak confirmation. No significant changes have occurred since the last update, and both indices are expected to follow similar cycle paths.
 
Gold was potentially forming a significant cycle peak, possibly an 18-year cycle peak, around mid-April of 2025, but without confirmation, as its price moves in a contracting wedge and lacks the typical sharp, isolated peaks. 
 
Gold (weekly bars): 18-year peak likely still ahead (allow 1-2 years of leeway). 

Hence, doubts persist about the 18-year peak, with suggestions the April 22 high may be a 20-week or 40-week peak instead, the true 18-year peak likely still ahead due to cycle variation allowing a year or two of leeway. A 40-week cycle trough formed on May 15, and an 80-day cycle trough is expected in early August, with the price crossing below the 20-day FLD, targeting around $3,250, followed by a potential bounce. 
 
Bitcoin saw the 18-month cycle trough in August 2024 (the first in the current 54-month cycle), and a 40-week trough in April 2025, where the cycle FLD provided support. 
 
Bitcoin (weekly bars): next 18-month cycle trough by year-end
or early 2026 (the second in the current 54-month cycle).
 
Bitcoin (monthly bars):
18-month and 54-month cycle peaks and troughs.
 

S&P 500 Likely Topping 40-Week Hurst Cycle This Week | Krasi

The pattern is on track to complete this week at week 34, in line with the projected 40-week cycle high (typical range: 32–36 weeks). Market breadth is deteriorating, with persistent negative divergences confirming a sell bias.

An ideal impulsive structure in wave C or Y suggests that the market is nearing the end of a five-wave impulsive move
(waves 1 through 5) within either wave C of a corrective pattern (e.g., a zigzag or flat) or wave Y of a complex correction
(e.g., a triangle or double/triple three).

This likely marks a significant top—at minimum a 40-week high—with increased probability that it’s the 4-year cycle peak. Minor waves 4 and 5 remain to complete, potentially finalizing an ideal impulsive structure in wave C or Y, thus terminating the broader pattern.

Reference:
Krasi (July 28, 2025)  - Quick Update.

Every dip's a wave—until it’s not.

See also:

Friday, July 25, 2025

August 2025 Post-Election Year Seasonality of US Stock Indexes | Jeff Hirsch

August was the best DJIA month from 1901–1951, driven by agriculture and farming. Since 1988, however, it has become the worst month for DJIA and Russell 2000, and the second worst for S&P 500, NASDAQ, and Russell 1000, with average returns from +0.1% (NASDAQ) to –0.8% (DJIA). In August 2022, all major indexes fell over 4%; in 2023, losses exceeded 1.8%.
 
Down from August 4 (Mon) into August 19 (Tue), mid- to late-month sideways to down, up into month end.

Since 1950, in post-election years (dashed lines in chart above), August typically starts strong with average gains in the first two trading days, then declines until shortly after mid-month. A rebound of varying size and length usually follows, before major indexes end the month in choppy or sideways trading.
 

The S&P 500 rises steadily through July (blue STA Aggregate Cycle), 
peaks in early August, and pulls back into late August.
 
In post-election years, August has been even weaker: it’s the worst month for DJIA and Russell 1000, second worst for S&P 500, NASDAQ, and Russell 2000. Average losses range from –0.5% (Russell 2000) to –1.5% (DJIA), with more down Augusts than up across all indexes.
  
Reference:
 
 
Bank of America (BoA) analyst Paul Ciana highlights a historical S&P 500 trend since 1928, where the average trend tended to be frontloaded in July, peaking by the end of August and correcting lower in September. However, since 2015 a similar pattern with a mid-August peak developed while the median trend sees a late September peak.


The summer doldrums (late June to early September) typically see 20-40% lower trading volumes and variable volatility due to reduced market participation. Equities, bonds, commodities, and forex show subdued activity, with occasional volatility spikes due to low liquidity, and, in August 2025, possibly from more US tariffs craze and geopolitical events. 
 
  
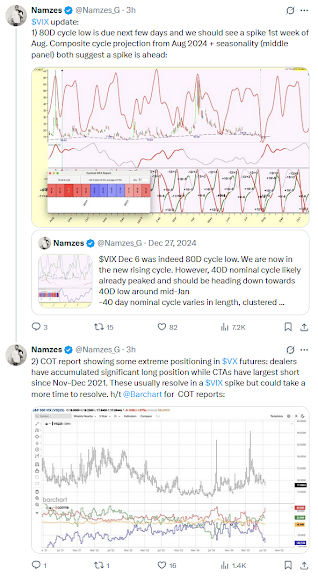
The latest Commitment of Traders (COT) report (see above) reveals extreme positioning in VIX futures, with dealers (= banks, broker-dealers, intermediaries managing risk from client trades, not speculating) holding substantial long positions and CTAs (= hedge funds, who are on the other side of the trade, typically as speculators) showing their largest short exposure since November–December 2021—a pattern that has frequently preceded spikes in the VIX. This unusual market setup suggests potential volatility in early August 2025 and aligns with Namze's forecast of an 80-day cycle low in the VIX during that period. However, the resolution may be delayed due to the scale of the positioning. 


According to BofA Global Research, the average US Presidential Cycle Year 1
(1928-2024) peaks in July and falls around 8% by year-end.
 
A seasonal cycle analysis by Ned Davis Research on the 2025 S&P 500 composite—blending the standard seasonal, 4-year Presidential, and 10-year decennial cycles—projects a current peak, choppy action through October, a late-year drawdown,
and a strong Q4 rally. August and September appear as potential weak spots.

 Bitcoin Seasonal Pattern 2018-2024 vs 2025.
 
See also:

Monday, July 14, 2025

S&P 500 and NASDAQ Headed for August Cycle Troughs | David Hickson

The S&P 500 analysis highlights a significant 18-month cycle trough formed in early April 2025, potentially of greater magnitude, driving recent bullish price action. An 80-day cycle trough occurred in the third week of June, aligning with the 80-day Future Line of Demarcation (FLD), a key cycle tool indicating support levels. 
 
An 18-month cycle trough in April 2025 has fueled recent gains, with an 80-day cycle trough in June confirming support via the FLD. A 40-day trough is due late July, followed by a deeper 20-week trough in August, forming a bullish M-shape pattern under longer-cycle upward pressure.
 
The dashed red composite model line aggregates cycle wavelengths and amplitudes to project future price movements. It closely mirrors past price action and forecasts a 40-day cycle trough in the third or final week of July, followed by a 20-week cycle trough around the third week of August. The composite model suggests a 20-week cycle peak is imminent or may have just occurred, with prices expected to decline into the 40-day trough, bounce slightly, and then fall into the 20-week trough, forming a bullish, distorted M-shape due to upward pressure from longer 18-month and 40-week cycles. The 20-week FLD will be critical for confirming support at the August trough, with shorter FLDs used to verify the peak.

Upcoming 20 Week Cycle Peak in the S&P 500.
 
The NASDAQ mirrors this pattern, with a significant cycle trough in April (at least 40-week magnitude, possibly 18-month), and a similar sequence of a 40-day trough in late July and a 20-week trough by late August. The composite model line indicates a smaller bounce after the 40-day trough compared to the S&P 500, but bullish pressure persists due to the April trough’s magnitude.
 
Tracking similarly to the S&P, the NASDAQ saw a major April trough (40-week or 18-month), with a 40-day cycle low expected in late July and a 20-week trough by late August. The bounce may be smaller than the S&P’s, but bullish momentum continues due to the strength of the April trough.

 
The 80-day FLD supported the June trough, and the 20-week FLD will be monitored to confirm support for the August trough, especially if the April trough matches the S&P 500’s 18-month magnitude. The principle of commonality underscores the synchronized movements across these markets. While the composite model’s price projections are less reliable due to cycle amplitude and wavelength variations, its shape provides a clear guide for expected market trends over the next several weeks.
 

Saturday, July 12, 2025

Seasonal Weakness in US Stocks During July Options Expirations | Jeff Hirsch

Since 1990, the Friday of July’s monthly options expiration week has shown a bearish bias for the DJIA, which declined 21 times in 35 years, with two unchanged years—1991 and 1995. On that Friday, the average loss is 0.36% for the DJIA and 0.35% for the S&P 500.

 DJIA down 21 of 35 years (60%) on July expiration Friday, averaging a 0.36% loss.
 
The NASDAQ has declined in 23 of the past 35 years during this week, with an average loss of 0.46%, including seven consecutive down years most recently. This trend suggests a potential seasonal bearish pattern likely linked to options trading dynamics.

NASDAQ down 23 of 35 years (65%) on July expiration Friday, averaging a 0.46% loss.

For the full week, the DJIA posts the best performance, rising in 21 of 35 years with an average gain of 0.39%. However, the NASDAQ has been the weakest, declining in 21 years—including the last seven consecutively—with an average loss of 0.18%.

S&P 500 down 21 of 35 years (60%) on July expiration Friday, averaging a 0.35% loss.

The week following monthly options expiration also tends to be bearish for the NASDAQ, which averages a loss, compared to mild gains for the DJIA and S&P 500.