J.M. Hurst’s Cyclic Theory
James M. Hurst, an American aerospace engineer, is widely regarded as the "father of modern cyclic analysis" due to his pioneering work in applying computational methods to study cyclical patterns in financial markets during the 1960s and 1970s. His innovative use of early mainframe computers to analyze price movements marked a significant departure from traditional technical analysis, establishing a systematic, scientific approach to understanding market behavior. Below is a detailed exploration of Hurst’s life, his cyclic theory, its principles, applications, and its lasting impact on technical analysis.


James M. Hurst (1924—2005).
The Profit Magic of Stock Transaction Timing (1970): A book that introduced his cyclic theory to a broader audience, outlining a simplified methodology for applying cyclic principles to trading.
The Cyclitec Cycles Course (also known as J.M. Hurst’s Cycles Course): A comprehensive, workshop-style course published in the early 1970s, which provided an in-depth exploration of his cyclic analysis techniques. This course, spanning over 1,500 pages, was initially distributed to a limited audience (approximately 250 copies) and later republished by Traders Press until 2012.
The Cyclitec Cycles Course (also known as J.M. Hurst’s Cycles Course): A comprehensive, workshop-style course published in the early 1970s, which provided an in-depth exploration of his cyclic analysis techniques. This course, spanning over 1,500 pages, was initially distributed to a limited audience (approximately 250 copies) and later republished by Traders Press until 2012.

Hurst claimed a 90% success rate trading on the basis of his theory, and yet the theory has remained largely undiscovered and often misunderstood. Despite his significant contributions, he remained a relatively enigmatic figure. After teaching seminars for a few years in the early 1970s, he largely withdrew from public life, and little is known about his later years. He passed away in 2005, leaving behind a legacy that continues to influence technical analysts and traders. His work gained renewed interest in 2011, when South African filmmaker and trader David Hickson used modern computing and his Sentient Trader platform to make Hurst's complex methods more accessible.
A key aspect of Hurst’s cyclic principles is that multiple cycles influence the price movements of any financial market simultaneously. Unlike other cyclic theories, Hurst’s approach emphasizes that these multiple cycles work together to shape price movements.
Another critical concept is that the cycles affecting financial markets operate continuously—24 hours a day, 7 days a week, 365 days a year—regardless of whether the market is actively trading. This continuous influence underscores the importance of understanding cycles to predict price movements accurately.
%20-%20J.%20M.%20Hurst%20Cycles%20Trading%20Course%20%5B1177%20p.%5D%20conv%2090.png)
Hurst’s cycles are not a random collection of varying lengths. Instead, they are organized in what Hurst called the nominal model, a structured list of cycles with harmonically related wavelengths. For example, Hurst’s default nominal model includes cycles ranging from the 18-year cycle (with an average wavelength of 6,547.2 days, or approximately 17.93 years) down to shorter cycles, such as 5 days. In developing Sentient Trader, David Hickson extended this model to include intraday cycles as short as 3 minutes. The harmonic relationship means that the wavelength of one cycle (e.g., the 18-year cycle) is related to another (e.g., the 9-year cycle) by a simple ratio, such as 2:1.

While cycles have average wavelengths, they are not fixed. A fundamental principle of Hurst’s theory is that cycle wavelengths vary. For instance, the 18-year cycle’s average length is 17.93 years, but its actual duration may fluctuate. Understanding this variation is crucial for applying Hurst’s principles effectively in trading.

or summation cycle of the three to four most prominent cycles (red), and thus from actual market price extremes.
Core Principles
Hurst’s Cyclic Theory is based on the premise that financial market price movements are not random but are driven by a combination of harmonically related cycles. These cycles, varying in duration and amplitude, combine to produce the complex price patterns observed in markets. Hurst’s approach refutes the random walk hypothesis, which posits that price movements are unpredictable, by demonstrating that they follow ordered, quasi-predictable patterns. His theory is grounded in eight key principles, which distinguish it from other cyclic theories:
2. Principle of Cyclicality: Financial markets exhibit repetitive, predictable cycles with consistent wavelengths (e.g., 5-day, 20-day, 18-year), driven by economic and behavioral factors. This enables traders to identify and forecast price trends, as cycles remain a fundamental market trait despite variations, supporting pattern-based analysis across timeframes and assets.
3. Principle of Summation: Market price movements arise from the combined influence of multiple cycles with varying wavelengths (e.g., 5-day, 20-day, 18-year), where shorter cycles produce smaller fluctuations and longer cycles drive larger trends. This enables traders to analyze price patterns by summing cycle effects, improving forecasting accuracy despite variations across timeframes and assets.
6. Principle of Proportionality: The amplitude of a cycle is proportional to its wavelength. Longer cycles tend to have larger price swings, while shorter cycles have smaller amplitudes. Cycle amplitudes are proportional to their wavelengths, meaning longer cycles produce larger price swings while shorter ones yield smaller amplitudes, such as a 20-week cycle moving twice as far as a 10-week or an 80-day cycle having about four times the amplitude of a 20-day. This principle complements harmonicity, where cycles relate by small integer ratios like 2:1 (e.g., 18-year cycle twice the 9-year), ensuring structured relationships across time scales in the nominal model.
1. Principle of Commonality: Market cycles share similar patterns across diverse markets and timeframes, with consistent harmonic wavelengths (e.g., 5-day, 20-day, 18-year) and synchronized troughs in stocks, commodities, or forex. This universal behavior enables traders to apply a unified cyclical analysis framework to identify trends and forecast price movements, despite specific market variations.
2. Principle of Cyclicality: Financial markets exhibit repetitive, predictable cycles with consistent wavelengths (e.g., 5-day, 20-day, 18-year), driven by economic and behavioral factors. This enables traders to identify and forecast price trends, as cycles remain a fundamental market trait despite variations, supporting pattern-based analysis across timeframes and assets.
The Principle of Cyclicality.
3. Principle of Summation: Market price movements arise from the combined influence of multiple cycles with varying wavelengths (e.g., 5-day, 20-day, 18-year), where shorter cycles produce smaller fluctuations and longer cycles drive larger trends. This enables traders to analyze price patterns by summing cycle effects, improving forecasting accuracy despite variations across timeframes and assets.
4. Principle of Harmonicity: Market cycle wavelengths relate by small integer ratios, typically 2:1 or 3:1 (e.g., 5-day, 10-day, 20-day, or 9-year, 18-year cycles), forming a harmonic structure aligning cycles across timeframes. This enables traders to predict price movements by identifying proportional relationships, enhancing analysis despite variations in cycle lengths.
The Principles of Harmonicity & Synchronicity.
5. Principle of Synchronicity: Cycles are synchronized at their troughs rather than their peaks, meaning significant market lows tend to align across multiple cycle wavelengths. Market cycles align their troughs, with cycles like 5-day, 10-day, and 20-day converging at the lows of longer cycles, such as 40-day or 18-year, driven by harmonic ratios. This synchronization aids trend identification and forecasting in tools like MotiveWave, despite variations disrupting perfect alignment. The principle offers a framework for predicting major market turning points by observing coincident cycle lows.
6. Principle of Proportionality: The amplitude of a cycle is proportional to its wavelength. Longer cycles tend to have larger price swings, while shorter cycles have smaller amplitudes. Cycle amplitudes are proportional to their wavelengths, meaning longer cycles produce larger price swings while shorter ones yield smaller amplitudes, such as a 20-week cycle moving twice as far as a 10-week or an 80-day cycle having about four times the amplitude of a 20-day. This principle complements harmonicity, where cycles relate by small integer ratios like 2:1 (e.g., 18-year cycle twice the 9-year), ensuring structured relationships across time scales in the nominal model.
7. Principle of Nominality: There exists a nominal set of harmonically related cycles that are common across all markets. Hurst identified a model of cycle durations, such as 5 days, 10 days, 20 days, 40 days, 80 days, 20 weeks, 40 weeks, 18 months, and 54 months. This principle establishes a hierarchical structure of market cycles with average wavelengths that approximately double, such as 5-day, 10-day, 20-day, 40-day, 80-day, and up to 18-year cycles, creating a consistent nominal model. This harmonic framework, often following 2:1 ratios, enables traders to identify dominant cycles despite variations. Though deviations exist, the principle ensures systematic cycle alignment, aiding analysis of synchronized troughs and market trends.
The Principle of Nominality.
8. Principle of Variation: While cycles follow the above principles, they exhibit variability in wavelength, amplitude, and synchronicity, allowing for some randomness and influence from fundamental events. Cycle lengths, amplitudes, and synchronicity fluctuate, with nominal lengths like the 18-year cycle (averaging 17.93 years) or 20-day cycle (19.2-20.4 days) varying significantly. Analysts apply 20% minimum and 30% maximum tolerances to manage these variations, e.g., allowing a 10-day cycle (8.5 days wavelength) to range from 6.8 to 11.05 days. These tolerances prevent cycle overlap, but inherent margins of error make cycles indefinite guides.

54 Month Cycle = 3 x 18 Month Cycle = 6 x 40 Week Cycle (9 Month Cycle) = 12 x 20 Week Cycle
= 24 x 80 Day Cycle = 48 x 40 Day Cycle = 96 x 20 Day Cycle = 192 x 10 Day Cycle = 384 x 5 Day Cycle

The 54-month cycle, made up of three 18-month cycles, marks the midpoint of the 9-year cycle, which is half of the 18-year cycle.

Hurst's nominal model as a series of sinusoids and summed to create the black 'composite model.' Here the orange line is the 18 month cycle, the light green the 40 week cycle, dark green the 20 week component, light blue the 80 day component, dark blue the 40 day component and finally the 20 day cycle is the purple sinusoid. The X axis represents the number of days.

The 54-month cycle and its subdivisions.
.jpg)
The 18-month cycle composed of a bullish 9-month cycle phase and a bearish 9-month cycle phase.

18-Month Cycle Projection for the S&P 500 based on Hurst's Nominal Model.

Projection for the S&P 500 during the bullish 9-month cycle phase of the 18-Month Cycle.
The Nominal Model
Hurst’s research identified a set of nominal cycles that he believed were common across financial markets. These cycles are harmonically related and form the basis for his analysis. A simplified version of his nominal cycle model, as extended by later researchers like David Hickson, includes:
These cycles are related by small integer ratios (e.g., a 20-day cycle is twice a 10-day cycle, and a 54-month cycle is three times an 18-month cycle). This harmonic structure allows analysts to break down price movements into their constituent cycles and predict future price action based on their interactions.
5-day cycle (≈ 4.3 days)
10-day cycle (≈ 8.5 days or 1.25 weeks)
20-day cycle (≈ 17 days or 2.5 weeks)
40-day cycle (≈ 34.1 days or 5 weeks)
80-day cycle (≈ 68.2 days or 10 weeks)
20-week cycle (≈ 136.4 days or 19.97 weeks or 4.5 months)
40-week cycle (≈ 272.8 days or 38.97 weeks or 9 months)
18-month cycle (≈ 17.93 months)
54-month cycle (≈ 4.5 years)
9-year cycle (≈ 8.96 years)
18-year cycle (≈ 17.93 years)
These cycles are related by small integer ratios (e.g., a 20-day cycle is twice a 10-day cycle, and a 54-month cycle is three times an 18-month cycle). This harmonic structure allows analysts to break down price movements into their constituent cycles and predict future price action based on their interactions.
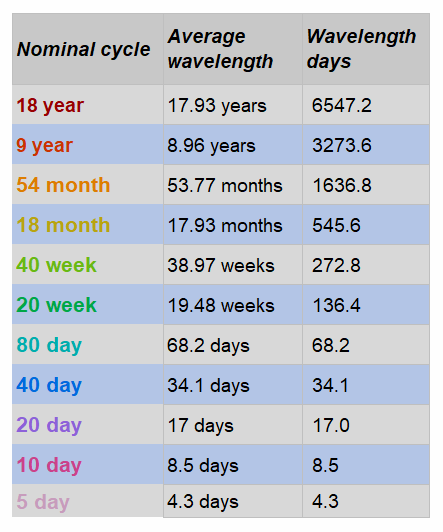
Nominal Cycle vs Average Cycle or Wavelength.
Instead of an infinite variety of individual cycles in price history, there seems to be a specific set of cycles. These cycles exhibit the characteristics discussed earlier but are distinct from one another. Hurst referred to this as the Nominal Model.
- The longest cycle identified in this model spans 54 years, followed by an 18-year cycle, and the shortest at this level is 9 years. For Hurst's cycle analysis, these are considered very long-term trends.
- On a monthly scale, the 9-year cycle breaks down into two 54-month cycles, which further split into three 18-month cycles (often referred to as 80 weeks), and then into two nine-month cycles.
- The nine-month cycle corresponds to a 40-week cycle, consisting of two 20-week cycles that further divide into two 10-week cycles.
- The 10-week cycle is represented as an 80-day cycle on daily charts, which breaks down into 40-day, 20-day, and 10-day cycles.
- Additionally, cycles exist that are longer than 54 years and shorter than 10 days.
Note
that e.g. a so called 20-day cycle low can occur several days before or
after the expected 20 days from the previous low, which may also have
occurred several days outside its ideal timeframe. The 20-day cycle,
based on spectral or other analyses, might actually be 19.2 days or 20.4
days. Consequently, cycle periods are indefinite and carry a margin of
error. For investment purposes, this means all cycles should be regarded
as guides. Even the well-established seasonal cycle has actual high and
low dates that can vary significantly from year to year.

An
intriguing aspect of cycles, first noted by Hurst in market data, is
that they often have period lengths that are multiples of two or three,
either longer or shorter than the subsequent cycles. For instance, a
20-day cycle might suggest the presence of another longer cycle lasting
either 40 or 60 days, as well as a shorter cycle of 7 or 10 days. The
longer cycle would be either two or three times the observed cycle,
while the shorter cycle would be one-third or one-half of it. This
observation proves useful when identifying a specific cycle, as it
directs the analyst to the relevant intervals for both longer and
shorter cycles. Hurst contends that a ratio of two is more common,
whereas others, like Tony Plummer (2003), have proposed that three is
the appropriate multiple.

Key Tools and Techniques
Hurst developed several tools and techniques to apply his cyclic theory to trading and investing. These include:
2. Valid Trend Lines (VTLs): VTLs are drawn by connecting the troughs of two recent cycles of the same degree and extending the line forward. A price crossing below a VTL confirms a peak in a cycle of a higher degree, helping traders validate cycle placement and anticipate reversals.
1.
Phasing Analysis: This involves identifying the phase (trough, peak, or
in-between) of each cycle influencing the market. By analyzing
historical price data, traders can determine the timing and magnitude of
cycles to predict future price movements. Phasing analysis is central
to Hurst’s methodology and is described as a combination of science and
art.
2. Valid Trend Lines (VTLs): VTLs are drawn by connecting the troughs of two recent cycles of the same degree and extending the line forward. A price crossing below a VTL confirms a peak in a cycle of a higher degree, helping traders validate cycle placement and anticipate reversals.
3.
Future Lines of Demarcation (FLDs): FLDs are projections of past cycle
troughs shifted forward by the wavelength of a specific cycle. They
serve as dynamic support and resistance levels, helping traders identify
potential price reversal points. For example, if a 20-day cycle trough
is projected forward, the FLD can indicate where the next trough or peak
might
occur.
4.
Channel and Envelope Analysis: Hurst used channels and envelopes to
visualize cycle-driven price movements. Channels are formed by drawing
parallel lines around price action, capturing the cyclical swings, while
envelopes smooth the price data to highlight dominant cycles. These
tools aid in forecasting price targets and
reversals.
5.
Cycle-Based Trading Strategies: Hurst’s methodology emphasizes timing
trades based on cycle troughs and peaks. For example, buying at a trough
of a shorter cycle (e.g., 20 days) when supported by a longer cycle
(e.g., 80 days) can lead to high-probability trades. His approach also
includes risk management and position sizing, as seen in modern tools
like the OddsTrader app.
.png)


Note: Hurst's average wavelengths can contract and expand significantly (± 10-15%).
Hurst’s Nominal Model is based on calendar time and not trading time, which presents a slight problem for anyone using a trading platform set up only to show trading days, which of course means pretty much everyone. The following conversion therefore needs to be made at the daily level:
- There are roughly 250 trading days in a 365-day calendar year. To convert calendar days to trading days, therefore, multiply by 0.7 (250/365).
- Conversely, to convert trading days into calendar days, divide by 0.7 (multiply by 1.42).
- Thus, the nominal 80-day cycle is 80 x 0.7, or 56 trading days.
- The nominal 40-day cycle is 40 x 0.7, or 28 trading days.
- The nominal 20-day cycle is 20 x 0.7, or 14 trading days, and so on.
These numbers should be familiar to most technicians as the basis for the popular 55-day moving average; the 26-day standard setting for MACD; and the 14-day default settings for RSI, DMI and Stochastics.
There are numerous enthusiastic advocates—prominent traders and writers—who proclaim Hurst as the “father of cyclic analysis” and attest to the effectiveness of his theory (including the late Brian Millard, who authored several books on the subject). Yet, why isn’t the theory better known or more widely used by technical analysts? There are two main reasons:
Firstly, Hurst’s Cyclic Theory is not “easy.” While it is beautifully simple and elegant in essence, it is neither easy to understand nor straightforward to apply. "The Cycles Course" spans over 1,500 pages, and most readers take several months to work through it.
Secondly, although the theory presented in both "Profit Magic" and "The Cycles Course" is the same at its core, there is a critically important distinction between the analytical processes outlined in each. Hurst attributed his success to the method presented in "The Cycles Course", yet many readers stop at "Profit Magic" and go no further—consequently, they never discover the more effective process found in the course.
Secondly, although the theory presented in both "Profit Magic" and "The Cycles Course" is the same at its core, there is a critically important distinction between the analytical processes outlined in each. Hurst attributed his success to the method presented in "The Cycles Course", yet many readers stop at "Profit Magic" and go no further—consequently, they never discover the more effective process found in the course.

Christopher Grafton’s book, Mastering Hurst Cycle Analysis (2011), modernized Hurst’s methods by providing code for indicators in programming languages, making them easier to implement on modern trading platforms. Grafton’s work includes over 120 color charts and practical examples, bridging the gap between Hurst’s complex theory and today’s traders.

The 9-Month Cycle
The most important cycle in market analysis is the 9-Month Cycle, also known as the 40-Week Cycle, 39-Week Cycle, or 8.6-Month Cycle. Many traders and analysts utilize this cycle because it is critical for intermediate-term market forecasting. It helps in planning for and identifying significant declines and rallies throughout the year. Even short-term traders should monitor the 9-Month Cycle to remain aligned with the broader trend.
.png)
The structure of the 9-Month Cycle consists of two 20-Week Cycles, referred to as Phase 1 and Phase 2. Each 20-Week Cycle is further divided into two 10-Week Cycles, also labeled Phase 1 and Phase 2.
Typically, the most powerful rally within the 9-Month Cycle occurs during the first three months,
as all three nesting cycles align to produce upward momentum.
Conversely, the market is most vulnerable to significant declines during
the last three months, when all three cycles trend downward.
In a bull market, the crest of the 9-Month Cycle generally occurs between the sixth and eighth month (right translation), while in a bear market, it is expected between the second and third month (left translation).
In addition to the crest of the 9-Month Cycle, the completion of the Phase 1 20-Week Cycle is another significant event. In a bull market, this often leads to a minor price correction or consolidation, whereas in a bear market, it likely coincides with the cycle crest.
Understanding the basic structure of the 9-Month Cycle reveals that the lowest risk for establishing new long positions typically occurs during the first three months, while the greatest risk of decline arises in the final three months. The middle three months require caution, as the Phase 1 20-Week Cycle may roll over into a trough—presenting both risks and opportunities with the onset of the Phase 2 20-Week Cycle.
