The Wyckoff Method, developed by Richard Wyckoff in the early 1900s, explains how stock (or asset) prices move in cycles driven by big players like institutions or "smart money" (often called the "Composite Man" or market makers). These pros manipulate prices to buy low and sell high, profiting from retail investors (you and me, the "weak hands" who buy/sell based on emotions).
Prices don't move randomly; they follow patterns in four main processes: Accumulation, Markup, Distribution, and Markdown. Within trends, there are pauses called Re-Accumulation (during uptrends) and Re-Distribution (during downtrends). Think of it like a chess game where smart money sets traps to take shares from scared or greedy small traders.
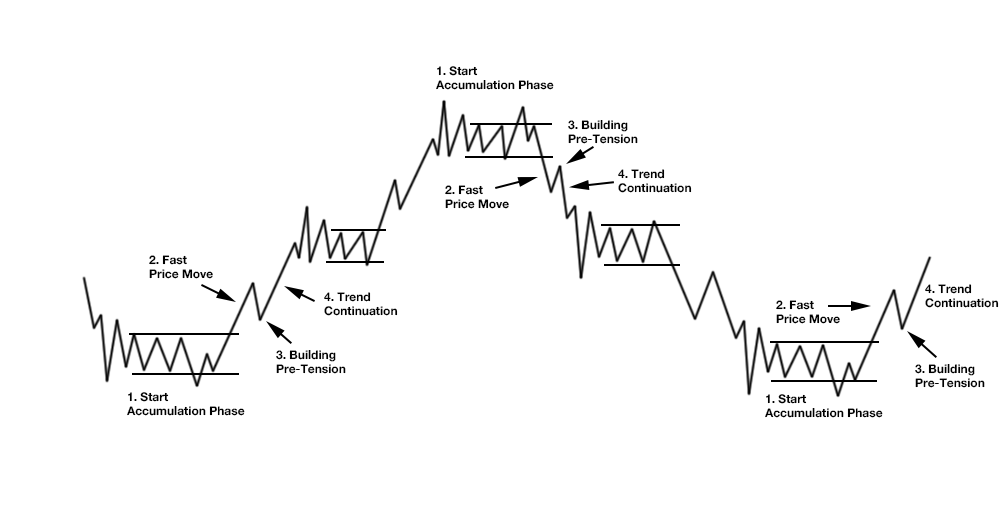
The Overall Market Cycle and Why It WorksMarkets cycle: Downtrend → Accumulation → Markup → Distribution → Markdown → Repeat. Smart money (institutions with deep pockets) engineers this by controlling volume and price action. They use news, rumors, and patterns to manipulate psychology—fear at bottoms, greed at tops. Retail reacts emotionally, providing the liquidity (shares to buy/sell) that smart money needs. Tools like volume analysis help spot these phases: High volume on climaxes, low on tests.
To spot in charts: Look for ranges after trends, volume changes, and failed breakouts. Practice on historical charts to see how pros always win by being patient and contrarian.
Larry Williams: How to Spot a Powerful Buy Signal in a Downtrend.
1. Accumulation: Buying Cheap at the Bottom
This happens after a long price drop (downtrend), when the market hits rock bottom. Everyone's panicking, selling cheap. Smart money sees value and starts secretly buying without driving prices up too fast.
%20-%20Price%20and%20Market%20Structures%20-%20Summary%20%5B2%20p.%5D-2.png)
Accumulation Characteristics.
Step 1: Preliminary Support (PS): Prices fall hard, but selling slows as smart money begins quiet buying to stop the drop. Volume (trading amount) is high from panic sellers, but price stabilizes a bit. Market makers absorb shares from weak hands dumping in fear.
Step 2: Selling Climax (SC): A final massive sell-off hits the lowest point. Volume explodes as retail dumps everything. Smart money buys aggressively here, creating a "climax" where selling exhausts itself. Price bounces slightly.
Step 3: Automatic Rally (AR): After the climax, price rises automatically as short-sellers (betting on further drops) cover positions, and some buyers return. This rally is short-lived, testing if selling is over.
Step 4: Secondary Test (ST): Price falls back to re-test the low from the climax, but on lower volume—meaning less selling pressure. If it holds, it confirms smart money has control. They might "spring" the price below support briefly to scare out remaining weak hands and grab their shares cheap.
Step 5: Building the Range: Price moves sideways in a "trading range" (box between support and resistance lines). Smart money accumulates millions of shares discreetly over weeks/months. They use "shakes" (fake drops) to buy more. Volume dries up on down moves (no real selling) and picks up on up moves.
What Market Makers Do: Act like sponges, soaking up supply from fearful sellers without alerting the public. They avoid bidding wars by timing buys during weakness. Goal: Own a huge position at low cost before the uptrend starts.
Other Participants: Retail sells in despair ("capitulation"). Weak institutions might sell too. Smart money traps shorts by not letting prices crash further.
End Sign: "Last Point of Support" (LPS)—a final test where price holds firm on tiny volume. Then, a "Sign of Strength" (SOS): Price breaks above resistance on high volume, starting the uptrend.
Result: Smart money now controls supply, ready to pump prices.
2. Markup: The Uptrend Rise
Once accumulated, smart money drives prices up for profit.
- Prices rise steadily or in waves. Volume increases on up days, decreases on pullbacks.
- Smart money sells a bit during rises to retail chasing gains (FOMO—fear of missing out), but holds most for higher prices.
- Pullbacks are shallow; smart money buys dips to keep momentum.
- This phase can last months/years, with news often turning positive to attract buyers.
3. Distribution: Selling High at the Top
Mirror of accumulation, but at peaks after a long rise. Euphoria peaks; retail buys high. Smart money sells into this greed without crashing prices immediately.
%20-%20Price%20and%20Market%20Structures%20-%20Summary%20%5B2%20p.%5D-1.png)
Distribution Characteristics.
Step 1: Preliminary Supply (PSY): Uptrend slows; first signs of heavy selling (supply) appear on high volume, but price doesn't drop much yet. Smart money starts offloading to eager buyers.
Step 2: Buying Climax (BC): Final frenzy—prices spike on huge volume as retail piles in. Smart money dumps massively here.
Step 3: Automatic Reaction (AR): Price falls automatically as buying exhausts. Tests if more demand exists.
Step 4: Secondary Test (ST): Price rallies back to re-test the high, but on lower volume—weak demand. Smart money might "upthrust" (fake breakout above resistance) to trap more buyers, then let it fall.
Step 5: Building the Range: Sideways range forms at the top. Smart money distributes shares to retail. Uses "upthrust after distribution" (UTAD) to fake strength, sucking in bulls before dropping.
What Market Makers Do: Flood the market with supply during hype, using rallies to sell without panic. They create illusions of strength (false breakouts) to offload at peak prices. Goal: Exit positions profitably before the crash.
Other Participants: Retail buys in greed, thinking the uptrend continues. Shorts get squeezed out. Weak hands get trapped holding overpriced assets.
End Sign: "Last Point of Supply" (LPSY)—final weak rally. Then, "Sign of Weakness" (SOW): Price breaks below support on high volume, starting the downtrend.
Result: Smart money cashes out; retail left holding the bag.
4. Markdown: The Downtrend Fall
Prices drop as supply overwhelms demand.
- Falls in waves, with brief rallies (dead cat bounces) where smart money might short more.
- Volume high on down days. News turns negative, scaring more sellers.
- Leads back to accumulation bottom.
5. Re-Accumulation: Pausing During Uptrends
Mid-uptrend pause to "reload." After a rally, momentum fades; smart money consolidates to buy more or shake out weak bulls.
- Shorter, tighter range than full accumulation.
- Involves "backing up to the creek" (minor drop to support) or "jumping the creek" (break above resistance).
- Smart money tests for remaining supply, absorbs it, then resumes markup.
- Looks like a mini-accumulation: Support tests, low-volume pullbacks, then strong breakout.
- What Happens: Prevents overheating; smart money builds more positions cheaply during dips, trapping shorts who think the uptrend ended.
6. Re-Distribution: Pausing During Downtrends
Mid-downtrend halt to "reload shorts." Fake recovery attracts buyers, allowing smart money to sell more or initiate shorts.
- Shorter than full distribution.
- Uses "upthrusts" or "jump across the creek" (false rallies) to trap longs.
- Smart money creates liquidity by luring buyers, then dumps to resume markdown.
- Looks like mini-distribution: False highs, high-volume failures, then breakdown.
- What Happens: Builds false hope; smart money offloads remaining longs or adds shorts during the fake strength.

» An understanding of manipulative procedure in any-event helps us to judge the motives, the hopes, fears and, aspirations of all the buyers and sellers whose actions today have the same net effect upon the market as 30 many pool operations would have. So if we are squeamish about the term "manipulator" we may substitute the words "Composite Operator" with the same force and affect.
Some people might object to this statement on the ground that regulation of the stock market has eliminated pool operations. Even though pool operations and old-fashioned manipulation are banned by law, for our purpose in studying, understanding and correctly interpreting market action, we must consider any operation a "manufactured" movement wherein the buying or the selling is sufficiently concerted and coming from interests better informed than the public as to produce the same effects as pure manipulation.
[...] The market is made by the minds of men, and all the fluctuations in the market and in all the various stocks should be studied as if they were the result of one man’s operations. Let us call him the Composite Man, who, in theory, sits behind the scenes and manipulates the stocks to your disadvantage if you do not understand the game as he plays it; and to your great profit if you do understand it.
Great activity and breadth induces trading in large quantities by big operators on the floor and outside. Such a market enables the manipulator to unload a large line of stock. When he wishes to accumulate a line, he raids the market for that stock, makes it look very weak, and gives it the appearance of heavy liquidation by sending in selling orders through a great number of brokers.You say all this is unethical, if not unscrupulous. You say it is a cruel and crooked game. Very well. Electricity can be very cruel, but you can take advantage of it; you can make it work for your benefit. Just so with the stock market and the Composite Man. Play the game as he plays it. I am giving you the inside view. «Richard D. Wyckoff1931
Richard Wyckoff's market cycle theory centers on accumulation and distribution phases driven by insiders. Accumulation occurs at market bottoms, where sophisticated players discreetly buy assets over months without spiking prices. It begins with preliminary support, stabilizing prices, followed by a selling climax where panic selling exhausts, allowing insiders to absorb shares. Secondary tests confirm this, forming a sideways range where insiders accumulate without attracting attention. Once filled, the markup phase starts as insiders push prices up, rumors spread, and retail investors buy aggressively, driving prices past value.
» At the bottom of a market, if the price spikes up, you should see the volume rise. That indicates accumulation. In the distribution stage, as the price falls, the volume should rise, while during price spikes upward, the volume should decline. By analyzing price and volume, you can determine whether you are in an accumulation phase or a distribution phase. That’s in an ideal world. «
» Insiders, highly sophisticated investors, accumulate assets discreetly, avoiding price spikes. Suddenly, the market surges as retail investors drive prices beyond intrinsic value. At this peak, distribution begins, with those same insiders covertly offloading their holdings.
Distribution follows at the top, where insiders offload positions surreptitiously into retail demand. This starts with preliminary supply, followed by a buying climax where insiders sell into FOMO-driven buying. A consolidation range forms, with upthrusts trapping late buyers before a markdown begins as prices collapse. Wyckoff’s framework, used in stocks, forex, and crypto, relies on volume and price action to spot these phases. I can analyze specific assets or charts for real-time signals if you provide details. «


See also:
Jim Forte (1994) - Anatomy of a Trading Range.
Hank Pruden & Max Lichtenstein (2006) - Wyckoff Schematics - Visual Templates for Market Timing Decisions.
Hank Pruden & Max Lichtenstein (2006) - Wyckoff Schematics - Visual Templates for Market Timing Decisions.
Roman Bogomazov (2022) - Wyckoff Method Trading and Education.
TPR (2022) - Daily and Weekly Market Maker Cycles - ICT Intraday Trading Templates.
TPR (2022) - Daily and Weekly Market Maker Cycles - ICT Intraday Trading Templates.
