Showing posts with label Price Action. Show all posts

Saturday, February 1, 2025

M & W Wave Patterns │ Arthur A. Merrill

In 1971, Robert A. Levy made the first attempt to systematically classify price patterns. He categorized five-point patterns, defined by price swings influenced by stock volatility, and tested their significance. Although he was unable to identify any substantial forecasting power, he introduced a valuable concept: the five-point categorization of time-price patterns.

» Pick any five consecutive turning points. If the first of the four swings is upward, 
the pattern forms an M. If the first swing is downward, the pattern is a W. «
Arthur A. Merrill, 1984.
 
This method remained dormant for a decade until Arthur A. Merrill revived it and published applicable results in the early 1980s: He employed the same five-point pattern approach, but instead of Levy's volatility filter, he used a rather large 8-percent swing filter in his research study. (Of course, since time and price are fractal, Merrill's patterns are too; they appear on every price swing scale across all timeframes.)
 
Merrill's 16 M and 16 W wave patterns, and their statistical occurrences: Are some of these patterns bullish? 
Are some bearish? When a certain pattern occurred in the past, what happened to prices after the pattern?

Merrill organized five-point patterns based on the sequential order of points from high to low, creating a structured taxonomy of "Ms" and "Ws". He identified 32 distinct patterns, grouping them into two categories: 16 resembling a capital M and 16 resembling a capital W. He then highlighted six subcategories, based on classical chart pattern names used by market technicians:

Uptrends                                            M15, M16, W14, W16
Downtrends                                      M1, M3, W1, W2
Triangle                                               M13, W4
Head and Shoulders                      W6, W7, W9, W11, W13, W15
Inverted Head and Shoulders    M2, M4, M6, M8, M10, M11
Broadening                                        M5, W12
 

For example, an M1 is a strongly descending pattern, while the middle patterns, M8 and M9, are flat. An M16 is a strongly ascending pattern. Similarly, a W1 is a descending pattern, the middle Ws are flat, and a W16 is an ascending pattern.
 
So, what is the practical application and benefit of Merrill's weird-looking M & W Wave Patterns in trading? They can be used to identify support/resistance levels, determine areas of interest, anticipate market direction and reversals, project extensions, define entry and exit points, and manage risk. 
 

How? You may want to watch the following video, as well as review the references and recommendations provided below.
 
 
Reference:
 
See also: 

Monday, January 20, 2025

How Markets Move: The Natural Cycle of Range Change │ Larry Williams

Markets typically shift from small ranges to larger trend moves. When the market is in a large trend move, wait for it to settle into smaller ranges before getting involved. This gives more reliable setups when the market trends again. Market tops generally occur when the price closes well off its low, while market bottoms happen when the price closes near its low. Most traders get emotional during these times, buying at tops and selling at bottoms. Once you understand this, it becomes easier to make smarter trades.

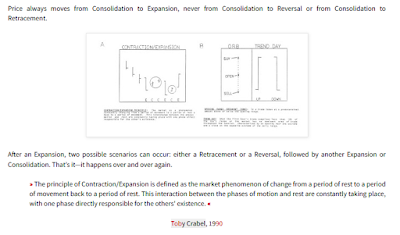
Small Ranges Beget Large Ranges. Large Ranges Beget Small Ranges.


Markets move from congestion to creation (expansion), transitioning from small ranges to larger, more defined trend moves. A small range signals buildup, and a large range signals an impending trend. If I see a small net change from open to close, I know a large trend move is likely coming and am prepared to act on it. Here’s an example using the NASDAQ: Notice how volume fluctuates throughout the day: heavy volume in the morning, a dip in the middle, and a surge towards the end. 

"U" shaped intraday: Heavy volume in the morning, a dip in the middle, a surge at the end.

This pattern is consistent across markets. It’s like a freeway: traffic is heavy in the morning, dies down in the middle of the day, and picks up in the afternoon. Understanding this helps day traders identify opportunities in the morning and towards the end of the day, while avoiding the midday lull. Volume drives range, and large ranges happen at the start and end of the day. This is when short-term traders make money. We need volatility and large ranges to profit.

 There are three key cycles in market behavior: 
(1) small range/large range, (2) moving closes within ranges, and (3) closes opposite openings. 
All three cycles work equally well in any timeframe and market.
"Do yourself a big favor: Mark off all the large-range days [in the chart above], and then study the size of the ranges just
prior to explosive up-and-down days. See what I see? We are given ample warning of virtually every large-range day 
by the shrinkage of ranges a few days earlier."

The key takeaway for short-term traders is that not every day offers a high-probability trade. You need to identify days with potential for explosive moves and not expect large profits daily. It’s about finding that opportunity.

As for market tops, they usually occur when prices close near their highs, and bottoms happen when prices close near their lows. Focus on these closing patterns to determine when to buy and sell.

Trend is a function of time. The more time in a trade, the more opportunity for trend.

The most important insight in trading is that trends are the basis of all profits. Without a trend, there are no profits. But what causes trends? Trends are fundamentally a function of time—the more time you hold a trade, the more opportunity for a trend to develop. The challenge with day trading is that trends occur only about 15% of the time. Most of the time, prices are consolidating, making it difficult to catch a big trend move. Limiting yourself to a few hours of trading only targets that small window when trends are likely to occur.

 My Day Trade Secret: HTTC - Hold To The Close.

The day trader dilemma is that they have limited time to catch trends. Holding positions overnight allows you to capture longer trends and larger profits. A small bet with the potential for a big move is the key advantage of holding positions over time. 
 
 » How you know a large trend move is coming. «
 
Many day traders are afraid to hold positions overnight. However, if you do the math, you'll see that most market moves happen between the close of one day and the open of the next. Moves within the day are often smaller and less reliable. For short-term traders, the key to success is recognizing large range days and holding positions to the close. This is how you catch a big move during the day.
 
 
 » Hold To The Close. « 
S&P 500 E-mini Futures (daily bars).
 Narrow Range 4 & 7 Days and Inside Bar Narrow Range 4 & 7 Days.

 Narrow Range 4 & 7 Days and Inside Bar Narrow Range 4 & 7 Days.

See also:

Friday, December 6, 2024

Memo from the Chief Economist: Lament of a Bear | David Rosenberg

One can reasonably debate whether the stock market has risen exponentially but there is no arguing that the surge in the S&P 500 these past two years has been nothing short of extraordinary. And it has clearly gone much further than I thought it would, especially in these past twelve months, and so at this point, it is worth the time and effort to discuss and interpret the message from the market.
 
 » Smells of capitulation. «

The bottom line: Tip the hat to the bulls who have, after all, been on the right side of the trade, and provide some rationale behind this powerful surge. This is not some attempt at a mea culpa or a throwing in of any towel, as much as the lament of a bear who has come to grips with the premise that while the market has definitely been exuberant, it may not actually be altogether that irrational. Read on.


See also:

Thursday, November 7, 2024

The 24 Chinese Solar Terms in 2025 │ Winter Begins Today ( 立冬 - Lì Dōng )

 Winter begins on November 7, which is 225° from the Vernal Equinox (0° Aries). 
This is what W.D. Gann referred to as a Natural Trading Day. 225° represents 0.618 of the solar year.
 
A solar term ( 節氣 ) is one of twenty-four periods in the traditional Chinese lunisolar calendar, each corresponding to a specific astronomical event or natural phenomenon. Starting from the spring equinox, these points are spaced 15 degrees, or roughly 15 days, apart along the ecliptic and are used by lunisolar calendars to remain synchronized with the seasons.

Changes in trend often occur every 30° as the Sun moves into the next sign of the zodiac.
30° roughly equals one month, 30 calendar days or 21 trading days.
 
W.D. Gann knew that the astronomical year begins on March 21st and that this was also a very important seasonal time for financial markets. He used geometrical divisions of the solar year (degrees of solar longitude as well as calendar days) to ascertain turning points. Changes in trend often occur every 30° as the Sun moves into the next sign of the zodiac.
 
Dates at 45°, 90°, 135°, 180°, 225°, 270°, and 315° solar degrees from the Vernal Equinox (0° Aries) are what Gann called Natural Trading Days, with 225° representing 0.618 of the solar year (November 7). Though 15°, 22.5° and 45° also may coincide with changes in trend, Gann stressed the importance of the cardinal points (90° apart). He also used multiples of 90° and 144°, i.e., 90°, 180°, 270°, etc., and 144°, 288°, 432°, 576°, 720°, etc. 
  
 
Combining the Chinese Solar Terms and Gann astro-methods for market timing with the following concepts may further increase the probability of accurately pinpointing market turns:


Saturday, September 14, 2024

Price Action Patterns & Entries at High and Low of the Day | Cameron Benson

Our focus is on price action trading at key levels: daily high and low, and the previous day's extremes. We examine how price reaches these levels — through Stair-Stepping or Ramping — and its subsequent behavior. The price action patterns include M's, W's, Double Tops/Bottoms, and Pin Hammers at daily highs and lows. 
 
 Stair-Stepping and M Patterns: These indicate potential reversals at daily highs or lows, 
with detailed entries and exits often managed through lower time frames.

Ramping is characterized by parabolic price movements and often leads to swift reversals. Observing tight candle patterns with minimal overlap helps identify strong trends and potential breakouts. We also look for specific patterns like Stair-Stepping and Three Pushes, with Peak Formations signaling possible reversals.

 
 Ramping Behavior: Recognized by tight, parabolic moves followed by rapid reversals. 
The ramp into extremes usually signals significant price shifts.


The following 5 minute charts of the NASDAQ are from last week
(September  9-13, 2024). They show Entry and Exit Strategies, using Pin Hammers and Engulfments for Entries, and managing stops based on price action, with adjustments for larger, more volatile bars.

Monday, September  9 (Day 1 of 3 Day Cycle):
 
 Identified an M pattern at the high of the day with a pin hammer and engulfment, suggesting a strong short entry.

Tuesday, September  10 (Day 2):

 
Despite a promising setup, a large entry bar resulted in a stop-out. 
Emphasis on avoiding large entry bars and managing risk.
 
Wednesday, September 11 (Day 3/1)
 
 Similar to previous days with M patterns and engulfments, also highlighting entry points and risk management.

Thursday (Day 2) and Friday (Day 3), September 12-13:
 
 Charts show patterns like descending triangles and W formations, 
with a focus on understanding price behavior relative to session timings.
 
Successful short-term trading relies on recognizing and acting upon the above presented price action patterns, managing entries and exits based on contextual behavior, and adapting strategies according to the specific market conditions within the 3 Day Cycle.
 

Sunday, September 8, 2024

Toby Crabel’s Bull Hook Trading Strategy Tested | Ali Casey

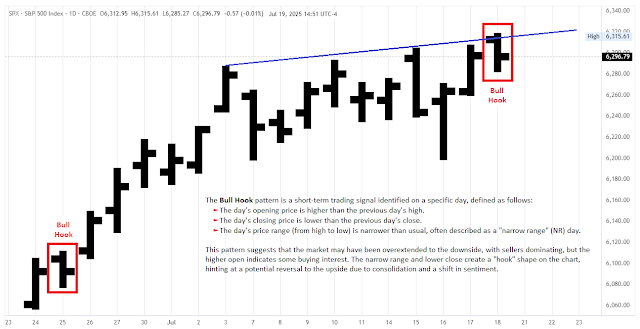
As an algo trader, I value patterns for their ease of programming and testing, which allows for the development of robust trading strategies. Today, we'll explore bull and bear hooks, patterns that can vary in details but generally serve to catch traders on the wrong side. Toby Crabel, Joe Ross, and Thomas Bulkowski, among others, have variations of these patterns.

Toby Crabel's original definition of the Bull Hook pattern:
» A Bull Hook occurs on Day 2. A Bull Hook is defined as a day with a higher open than the 
previous day's high followed by a lower close with a narrowing daily range. The next day (Day 1), 
a trade is taken on the initial move off the open, preferably to the upside. «
 
Toby Crabel's original definition of the Bear Hook pattern:
  » Bear Hook is a day in which the open is below the previous day's low and the close 
is above the previous day's close with a narrow range relative to the previous day. As implied by 
the name there is a tendency for the price action following a Bear Hook to move to the downside. «

The Bull Hook pattern has two main forms:

Bull Hook 1: In a downtrend, the pattern is identified when today's bar is an up bar with a smaller range than the previous day and is an inside day (high lower, low higher than the previous bar). We buy with a stop order above the high of this bar.
Bull Hook 2: Here, today's bar is a down bar with a smaller range than the previous day, opening above the previous high and closing below the previous close. This pattern involves just two bars.


For testing, I used TradeStation with S&P 500 e-mini futures data. The backtest for Bull Hook 1 was disappointing, showing a loss with only 15 trades, which seemed unusual given its pullback nature. A deeper analysis suggested that the specific conditions, particularly the inside day and green bar requirements, were limiting trades. By removing some conditions, like the inside day and green bar, and focusing on a simpler pullback strategy, the results improved significantly with about 200 trades and positive performance metrics. For Bull Hook 2, the test also yielded fewer trades than expected, which might be attributed to its breakout nature, not performing well on the S&P 500. Simplifying the conditions here also improved the results somewhat, though it remained less effective. The Bear Hook pattern, when flipped for long trades, performed better but still had a low trade count. Removing some conditions and simplifying it increased the trade count and improved performance. While both Bull Hook patterns had potential, their effectiveness was highly dependent on specific conditions and the number of trades generated. Simplifying the patterns often led to better results.

Friday, August 23, 2024

Recent Toby Crabel Price Pattern Setups in the E-mini S&P 500 Futures