Showing posts with label Short-Term Trading. Show all posts

Saturday, July 19, 2025

"Bull Hook" Toby Crabel Price Pattern in the S&P 500

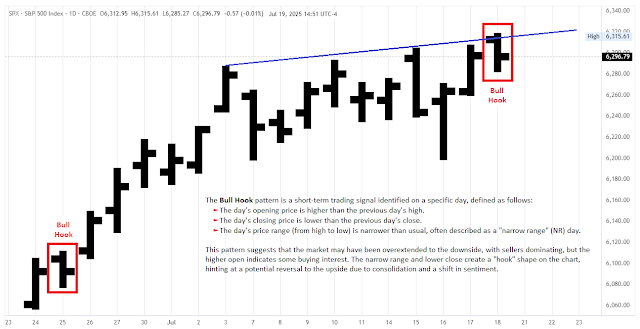
The Toby Crabel Bull Hook pattern, present on July 18 (Fri), in the S&P 500 Cash Index, implies a potential short-term upward move for trading starting July 21, 2025. 
 
A Bull Hook happens when a bar has a lower range than the previous one, with its opening price
higher than the previous bar’s high and its closing price lower than the previous bar’s close.
 
Price action created the narrowest range of the last 8 days with a lower daily close. The daily bar has a "hook" shape (a bull flag on lower timeframes), hinting at a potential reversal to the upside due to consolidation and a shift in sentiment. The Bull Hook pattern is generally bullish, opening above the previous day's high and closing lower with a narrowing range. It's often followed by upward price moves in the days after. 
 
A recent analysis by Ali Casey provides additional insights. The Bull Hook pattern has limitations, including its better performance in trending or volatile markets, the potential for false signals and losses in some cases, and its reliance on precise execution, which can be influenced by news or macroeconomic events.
 

Friday, July 18, 2025

Simple ICT Day Trading Strategy That Works Every Day │ JadeCap

This trading strategy focuses on entering positions based on significant daily highs and lows, utilizing ICT's "Power of Three" framework—accumulation, manipulation, and distribution. With this approach, I earned $4.5 million and I’m here to show you how simple it can be: 
 
» Do not trade if the market has already hit the target high/low. «
 
The Key is to target historical levels beyond just the last 24 hours and to use the New York midnight open for optimal entry points. By staying committed to the market direction from the previous day and timing your trades around key sessions like New York or London (ICT Kill Zones), you can capture manipulation moves for more favorable risk-to-reward ratios. 
 
» I’m here to show you how simple it can be. « 
 
Now, I'll walk you through the three-step process I use to achieve results every day:

1.) Identify Key LevelsDetermine the previous daily high or low as the target based on bullish or bearish conviction from prior day’s close.
2.) Assess Market Context: Confirm the market is trading below the previous daily high (for bullish trades) or above the previous daily low (for bearish trades) to avoid chasing price.
3.) Apply Power of Three:
Accumulation: Identify a range (e.g., Asian or London session) where orders build up.
Manipulation: Look for a temporary move against the expected direction (e.g., bearish move in a bullish setup) to trap traders.
Distribution: Enter trades as the market moves toward the target high/low, ideally near the midnight open for better risk-to-reward.


Entry and Risk Management
:
  • Enter trades on lower time frames (e.g., hourly) using setups like fair value gaps, order blocks, or liquidity raids that align with the high time frame direction.
  • Place stop losses logically (e.g., at 50% of a Fair Value Gap or below a key level).
  • Exit trades based on time (e.g., end of a 4-hour candle) or when the target is reached, avoiding overnight holds for futures.
Avoid Common Pitfalls:
  • Do not trade if the market has already hit the target high/low.
  • Avoid setups misaligned with the high time frame direction.
  • Trade smaller or not at all if the market has expanded in your direction before entry.
Reference:


See
 also:

Thursday, July 17, 2025

ICT Intraday Liquidity & Volatility Trading Playbook │ JadeCap

This strategy focuses on how price reacts to liquidity and volatility during the trading day. Liquidity refers to the areas on a chart where other traders have placed stop-loss orders, usually just above recent highs or just below recent lows. The market often moves into these areas to trigger those stops, and then either reverses sharply or continues strongly in the same direction.

Trade Example - NQ Short (1-H Chart)
 
The goal of this strategy is to spot those liquidity grabs, wait for a clear reaction, and then enter with confidence—either to trade the reversal or the continuation. The method is built for traders who prefer to focus on one trading day at a time, using clear logic, session structure, and precise timing.
 
On this episode of Chart Fanatics we are joined by Kyle Ng (AKA Jadecap). Regarded as ICT's best student and recently achieved a world record payout with Apex. Kyle reveals his complete ICT playbook that allowed him to generate millions from the markets. In this episode you'll learn how to manage open exposure and lock in profits, how to predict the next daily candle and the psychology behind avoiding greed in a trade. Riz Iqbal, May 15, 2025.

Each trade begins with a daily bias: a simple outlook on whether price is likely to move up or down today. Then the trader watches for session liquidity raids (like the Asian or London session highs/lows being taken out), and enters only after confirmation appears through a fair value gap, market structure shift, or divergence between markets. This model works well for intraday trades but can also be used for swing trades when the higher time frame aligns with the setup.

To take a trade using this model, the following must be true:

Clear Daily Bias: Decide if you’re bullish or bearish for the day using the daily chart.
Consider recent highs, lows, inefficiencies, and where the price is likely to go next.
Session Liquidity Zones Marked: These are common stop zones and entry traps:
Previous Day’s High and Low
Asian Session High/Low
London Session High/Low
Wait for a Liquidity Raid: A key session level must be taken out during the New York session — this is your signal
that stop orders have been hit and a potential move is beginning.
Confirmation on Lower Time Frame (15m / 5m). After the liquidity raid, wait for one of these confirmations:
Fair Value Gap (FVG)
Market Structure Shift (MSS)
Turtle Soup (false breakout and reversal)
Breaker Block
Ideal Time Window
Trade setups should form between 9:30 and 11:30 AM EST/EDT.
 
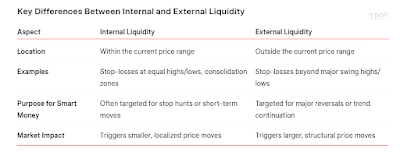
Key Differences Between Internal and External Liquidity.

Target & ExitYour target depends on the setup type. Intraday Targets: Opposite session liquidity, fair value gaps, or  equal highs/
lows. If the trade slows near midday, consider exiting  even before the full target is reached.
Swing Targets: Use higher time frame liquidity zones (daily/weekly highs or lows), imbalances, or major structure. 
Swing trades can be held for multiple days as long as the bias and structure support it. Use time-of-day awareness, price behavior, and your risk profile to decide whether to hold or exit early.

Pros & Cons of the Strategy
This model is designed to deliver high quality, repeatable setups — but like any trading method, there are key things to understand before using it. Note: The cons listed here aren’t disadvantages. They are things to be aware of — important characteristics that require patience, discipline, and proper management to make the model work effectively.
 

Trade Example - NQ Short (15-Min Chart)

Reference:
ooooOoooo
 
If markets continually trend higher, any run on short-term highs should only be seen as short term liquidity being taken. Any retracement lower should be framed as a return to internal range liquidity prior to continuation.This keeps you on the RIGHT side of the market and you stop anticipating major reversals. Never try to pick tops and bottoms. Leave that to the big boys. We only want to ride their coattails. JadeCap's Trading Room, July 16, 2025.
 
Looking for Tuesdays highs on ES. JadeCap's Trading Room, July 17, 2025, 9:03.
 
I stopped adding new concepts and tools and just focused on properly executing what I've already learned. A few lines, context, and ironclad risk management. Stop focusing on the P&L and the size of your trades. If you can trade 1 micro you can trade 10 minis. But you can't do that at scale without a solid PROCESS. JadeCap's Trading Room, July 17, 2025, 14:47

Sunday, July 13, 2025

"8 Bar Narrow Range" (8BNR) Toby Crabel Price Pattern in the NASDAQ

The 8 Bar Narrow Range (8BNR) is a technical trading pattern developed by Toby Crabel, introduced in his book "Day Trading with Short Term Price Patterns and Opening Range Breakout". 
 
 
It is part of his framework of price action patterns that focus on periods of volatility contraction (narrow price ranges) as precursors to potential volatility expansion (significant price movements). Here's an explanation of what the 8BNR pattern suggests and its implications for traders:

The 8BNR pattern occurs when the 8-day range (the difference between the highest high and the lowest low over an 8-day period) is the narrowest range compared to any other 8-day period within the last 40 trading sessionsThis indicates a period of low volatility or price consolidation, where the market has been trading in a relatively tight range over the past eight days compared to recent history.

The 8BNR signals a potential breakout, but it does not specify the direction. Traders often use the pattern in conjunction with Crabel’s ORB strategy:
 
Long Trade: Place a buy stop order at the open price plus the "stretch" (a calculated value based on the 10-day simple moving average of the smaller difference between the open and high/low).
Short Trade: Place a sell stop order at the open price minus the stretch.
 
Crabel’s research suggests that breakouts are more likely to be profitable if they occur early in the trading session. Trades triggered later in the day carry higher risk and may warrant smaller position sizes or avoidance of overnight holds. The 8BNR is more reliable when it occurs after a clear trend or during a pullback in a trending market. Multiple narrow range patterns in close proximity (e.g., consecutive NR7 or 3BNR, 4BNR, 8BNR days) may indicate congestion, reducing the reliability of the breakout.


Like all technical patterns, the 8BNR is not foolproof. False breakouts, market noise, or unexpected events can lead to losses. Traders should avoid mechanical application and incorporate additional technical or fundamental analysis to confirm signals. Always combine the pattern with other market analysis for best results.
  

Monday, January 20, 2025

How Markets Move: The Natural Cycle of Range Change │ Larry Williams

Markets typically shift from small ranges to larger trend moves. When the market is in a large trend move, wait for it to settle into smaller ranges before getting involved. This gives more reliable setups when the market trends again. Market tops generally occur when the price closes well off its low, while market bottoms happen when the price closes near its low. Most traders get emotional during these times, buying at tops and selling at bottoms. Once you understand this, it becomes easier to make smarter trades.

Small Ranges Beget Large Ranges. Large Ranges Beget Small Ranges.


Markets move from congestion to creation (expansion), transitioning from small ranges to larger, more defined trend moves. A small range signals buildup, and a large range signals an impending trend. If I see a small net change from open to close, I know a large trend move is likely coming and am prepared to act on it. Here’s an example using the NASDAQ: Notice how volume fluctuates throughout the day: heavy volume in the morning, a dip in the middle, and a surge towards the end. 

"U" shaped intraday: Heavy volume in the morning, a dip in the middle, a surge at the end.

This pattern is consistent across markets. It’s like a freeway: traffic is heavy in the morning, dies down in the middle of the day, and picks up in the afternoon. Understanding this helps day traders identify opportunities in the morning and towards the end of the day, while avoiding the midday lull. Volume drives range, and large ranges happen at the start and end of the day. This is when short-term traders make money. We need volatility and large ranges to profit.

 There are three key cycles in market behavior: 
(1) small range/large range, (2) moving closes within ranges, and (3) closes opposite openings. 
All three cycles work equally well in any timeframe and market.
"Do yourself a big favor: Mark off all the large-range days [in the chart above], and then study the size of the ranges just
prior to explosive up-and-down days. See what I see? We are given ample warning of virtually every large-range day 
by the shrinkage of ranges a few days earlier."

The key takeaway for short-term traders is that not every day offers a high-probability trade. You need to identify days with potential for explosive moves and not expect large profits daily. It’s about finding that opportunity.

As for market tops, they usually occur when prices close near their highs, and bottoms happen when prices close near their lows. Focus on these closing patterns to determine when to buy and sell.

Trend is a function of time. The more time in a trade, the more opportunity for trend.

The most important insight in trading is that trends are the basis of all profits. Without a trend, there are no profits. But what causes trends? Trends are fundamentally a function of time—the more time you hold a trade, the more opportunity for a trend to develop. The challenge with day trading is that trends occur only about 15% of the time. Most of the time, prices are consolidating, making it difficult to catch a big trend move. Limiting yourself to a few hours of trading only targets that small window when trends are likely to occur.

 My Day Trade Secret: HTTC - Hold To The Close.

The day trader dilemma is that they have limited time to catch trends. Holding positions overnight allows you to capture longer trends and larger profits. A small bet with the potential for a big move is the key advantage of holding positions over time. 
 
 » How you know a large trend move is coming. «
 
Many day traders are afraid to hold positions overnight. However, if you do the math, you'll see that most market moves happen between the close of one day and the open of the next. Moves within the day are often smaller and less reliable. For short-term traders, the key to success is recognizing large range days and holding positions to the close. This is how you catch a big move during the day.
 
 
 » Hold To The Close. « 
S&P 500 E-mini Futures (daily bars).
 Narrow Range 4 & 7 Days and Inside Bar Narrow Range 4 & 7 Days.

 Narrow Range 4 & 7 Days and Inside Bar Narrow Range 4 & 7 Days.

See also:

Friday, December 6, 2024

Memo from the Chief Economist: Lament of a Bear | David Rosenberg

One can reasonably debate whether the stock market has risen exponentially but there is no arguing that the surge in the S&P 500 these past two years has been nothing short of extraordinary. And it has clearly gone much further than I thought it would, especially in these past twelve months, and so at this point, it is worth the time and effort to discuss and interpret the message from the market.
 
 » Smells of capitulation. «

The bottom line: Tip the hat to the bulls who have, after all, been on the right side of the trade, and provide some rationale behind this powerful surge. This is not some attempt at a mea culpa or a throwing in of any towel, as much as the lament of a bear who has come to grips with the premise that while the market has definitely been exuberant, it may not actually be altogether that irrational. Read on.


See also:

Thursday, October 24, 2024

Halloween Trading Strategy Begins Next Week | Jeff Hirsch

Next week provides a special short-term seasonal opportunity, one of the most consistent of the year. The last 4 trading days of October and the first 3 trading days of November have a stellar record the last 30 years. From the tables below:


     S&P 500: Up 25 of last 30 years, average gain 1.96%, median gain 1.61%.
     NASDAQ: Up 25 of last 30 years, average gain 2.43%, median gain 2.29%.
     DJIA: Up 24 of last 30 years, average gain 1.95%, median gain 1.39%.
     Russell 2000: Up 23 of last 30 years, average gain 2.34%, median gain 2.56%.

Many refer to our "Best Six Months Tactical Seasonal Switching Strategy" as the "Halloween Indicator" or "Halloween Strategy" and of course “Sell in May”. These catch phrases highlight our discovery that was first published in 1986 in the 1987 Stock Trader’s Almanac that most of the market’s gains have been made from October 31 to April 30, while the market, on average, tends to go sideways to down from May through October.


Since issuing our Seasonal MACD Buy signal for DJIA, S&P 500, NASDAQ, and Russell 2000, on October 11, 2024, we have been moving into new long trades targeting seasonal strength in various sectors of the market via ETFs and a basket of new stock ideas. The above 7-day span is one specific period of strength during the “Best Months.” Plenty of time remains to take advantage of seasonal strength.

 
 Election-Year Octoberphobia — Jeff Hirsch, October 9, 2024
 
 November Performance in “All Years” (1930-2015) and “Election Years” (1932-2012) 

 
October 28th has, on average since 1950, been the strongest day of the year.


S&P 500 Seasonal Pattern for Q4 of the Election Year 2024
- Presidential Cycle in line with the Decennial Cycle.
 
 S&P 500 E-mini Futures (daily bars) and current 21-Trading Day Cycle ( ± 3 TD).
 
ooooOoooo
 
Goldman Sachs' technical strategist Scott Rubner indicates that US stocks are entering a favorable trading environment due to capital flow trends. He expects the quiet period for stock repurchases to end on October 25, with listed companies likely to engage in significant buybacks in November and December, estimated at $6 billion per day, accounting for 21.1% of annual buybacks.


As mutual funds, the largest sellers of US stocks, begin to withdraw before Halloween, this may positively impact stock prices. October marks the end of the fiscal year for most mutual funds, potentially leading to sell-offs of underperforming assets for tax reasons. Rubner noted that all 756 mutual funds, valued at $1.853 trillion, end their fiscal year on October 31, 2024. Historically, American households increase stock purchases in November, with capital inflows into mutual funds and ETFs peaking during this month.

 In Q4 2024, the NASDAQ may gain more than double what the S&P gains.

Looking ahead to the US election, Rubner suggests that post-election, market volatility may reset, benefiting various trading strategies. Additionally, strong non-farm payroll growth and shifting inflation expectations are becoming critical market factors, particularly regarding a potential Trump election victory, which may reignite trading interest.