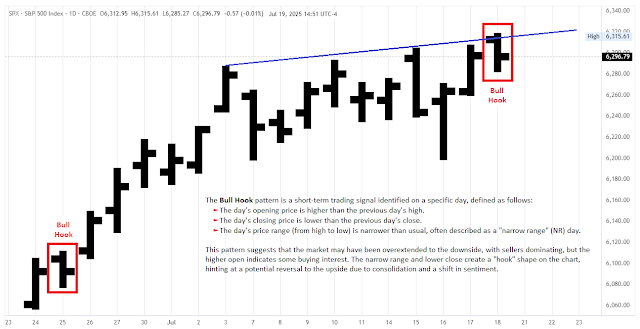
The Toby Crabel Bull Hook pattern, present on July 18 (Fri), in the S&P 500 Cash Index, implies a potential short-term upward move for trading starting July 21, 2025.
higher than the previous bar’s high and its
closing price lower than the previous bar’s close.
Price action created the narrowest range of the last 8 days with a lower daily close. The daily bar has a "hook" shape (a bull flag on lower timeframes), hinting at a potential reversal to the upside due to
consolidation and a shift in sentiment. The Bull Hook pattern is generally bullish, opening above the previous day's high and closing lower with a narrowing range. It's often followed by upward price moves in the days after.
A recent analysis by Ali Casey provides additional insights. The Bull Hook pattern has limitations, including its better performance in trending or volatile markets, the potential for false signals and losses in some cases, and its reliance on precise execution, which can be influenced by news or macroeconomic events.
