Toby Crabel wrote a book called 'Day Trading With Short Term Price Patterns and Opening Range Breakout' which is no longer in print and sometimes sold on eBay for more than $1,000. In this book he defines a number of trading patterns which have become popular numbers to calculate and watch among day traders and swing traders. He is a United States self-made billionaire commodities trader. The Financial Times called him "the most well-known trader on the counter-trend side." He is the fund manager of 'Crabel Capital Management', ranking number 101 out of 196 funds on Absolute Return magazine list Absolute Return survey of U.S. groups with more than $1 billion AUM, July 2005. This is the latest current ranking of the top 196 money managers in the US. Toby Crabel manages 3.2 billion dollars and had a growth of 16.7% in 2005. A producer of consistent returns whatever the weather, Crabel had avoided having a losing year from 1991 to 2002. The following are definitions of some of Crabel's concepts, patterns and setups.
Stretch
The Stretch is calculated by taking the 10 day Simple Moving Average (SMA) of the absolute difference between the Open and either the High or Low, whichever difference is smaller.
For example, if the Open is 1250, the High is 1258, and the Low is 1240, then we would take the value of 8 for that day because 1258-1250 is 8 which is smaller than 1250-1240 which is 10. We then add together all of these values for the last 10 trading days and divide this by 10 to get the 10 day SMA. This value will then become the Stretch. Stretch Calculation:
1. Take the Open, High and Low of each day.
2. Find delta of High - Open.
3. Find delta of Open - Low.
4. Which ever is lower between step 1 and step 2 take that value for each day.
5. Stretch = average of the values of past 10 days.
The Stretch is used in calculating where to enter the trade and where to place a stop using the ORB and ORBP trading strategies. Before buying and selling the Stretch, also consider support and resistance-levels derived from the Daily Classic Pivot Point.
Opening Range Breakout = ORB
Using this strategy, the trader places a buy stop just above the Open price plus the Stretch and a sell stop just below the Open price minus the Stretch. The first stop triggered enters the trader into the trade and the other stop becomes the protective stop.
Crabel's research shows that the earlier in the trading session the entry stop is hit the more likely the trade will be profitable at the close. A market movement that kicks off a trend quickly in the current trading session could add significant profit to a trader's position by the close and should be considered for a multi-day trade.
The ORB can be utilized as a general indicator of bias every day. Whichever side of the stretch is traded first will indicate bias in that direction for the next two to three hours of the session. This information alone will keep you out of trouble, if nothing else.
Multiple contracts can be used when entering on an ORB or ORBP. This allows for some profit taking as the move continues to guarantee at least some profit in the case of a pullback to the break-even stop. A trailing stop is also very effective.
If you miss the ORB and early entry occurred, any 3/8 to 1/2 retracement of the established range can be used as an entry point with stops beyond the 5/8 level. This technique can be utilized twice, but becomes treacherous on the third retracement.
Extending Crabel's research results it is obvious that as time passes and we are not filled early on then the risk increases and it becomes prudent to reduce the size of the position during the day. Trades filled towards the end of the day carry the most risk and the later in the day the trade is filled the less likely the trader will want to carry that trade overnight. Variations of this strategy include the Opening Range Breakout Preference (ORBP - HERE).
Opening Range Breakout Preference = ORBP
An ORBP trade is a one sided Opening Range Breakout (ORB) trade. If other technical indicators show a strong trend in one direction then the trader will exercise a "Preference" for the direction in which to trade the ORB trade. A stop to open a position would be placed on the side of the trend only and if filled a protective stop would then be placed. The calculation of where to place the "stop to open" would be the same as that for the ORB trade: For longs, the Open price plus the Stretch and for shorts the Open price minus the Stretch. The ORBP trade is a specialized form of the ORB trade (HERE).
Narrow Range = NR
If a price bar's Range is less than the previous bar's range it is said to have an NR. The opposite of NR is Wide Spread (WS). NR is technically NR2 when compared to NR4, NR5, and NR7.
Type: Trend-Continuation or Short-Term Breakout Set-up.
Conditions: The current bar has the narrowest range (high - low) of the last X bars. The bar may or may not be an inside bar. Buy and Sell reference are the high and low of the NR bar.
Narrow Range 4 = NR4
If a price bar's Range is less than the previous 3 bars' ranges (measured independently) it is said to have the narrowest range in 4 days or NR4. The opposite of NR4 is WS4. NR, NR5, and NR7 are also closely watched price patterns. Type: Trend-Continuation or Short-Term Breakout Set-up.
If a price bar's Range is less than the previous 4 bars' ranges (measured independently) it is said to have the narrowest range in 5 days or NR5. The opposite of NR5 is WS5. NR, NR4, and NR7 are also closely watched price patterns.
Type: Trend-Continuation or Short-Term Breakout Set-up
If a price bar's Range is less than the previous 6 bars' ranges (measured independently) it is said to have the narrowest range in 7 days or NR7. The opposite of NR7 is WS7. NR, NR4, and NR5 are also closely watched price patterns.
Type: Trend-Continuation or Short-Term Breakout Set-up.
Wide Spread = WS
If a price bar's Range is wider than the previous bar's range it is said to have a WS. The opposite of WS is NR. WS is technically WS2 when compared to WS4, WS5, and WS7.
Wide Spread 4 = WS4
If a price bar's Range is wider than the previous 3 bars' ranges (measured independently) it is said to have the widest range in 4 days or WS4. The opposite of WS4 is NR4. WS, WS5, and WS7 are also closely watched price patterns.
Wide Spread 5 = WS5
If a price bar's Range is wider than the previous 4 bars' ranges (measured independently) it is said to have the widest range in 5 days or WS5. The opposite of WS5 is NR5. WS, WS4, and WS7 are also closely watched price patterns.
Wide Spread 7 = WS7
If a price bar's Range is wider than the previous 6 bars' ranges (measured independently) it is said to have the widest range in 7 days or WS7. The opposite of WS7 is NR7. WS, WS4, and WS5 are also closely watched price patterns.
Inside Day/Bar = ID
If the high of the current day is lower than the high of the previous day AND the low of the current day is higher than the low of the previous day then we have an ID or Inside Day. The opposite to an ID is an Outside Day (OD).
Type: Trend-Continuation or Short-Term Breakout Set-up.
If the high of the current day is higher than the high of the previous day AND the low of the current day is lower than the low of the previous day then we have an OD or Outside Day. The opposite to an OD is an Inside Day (ID).
Bear Hook
Bear Hook is a day in which the open is below the previous day's low and the close is above the previous day's close with a narrow range relative to the previous day. As implied by the name there is a tendency for the price action following a Bear Hook to move to the downside. In other words: A Bear Hook occurs when you have an NR with the Open less than the previous bar's Low AND the Close greater than the previous bar's Close.
Bull Hook
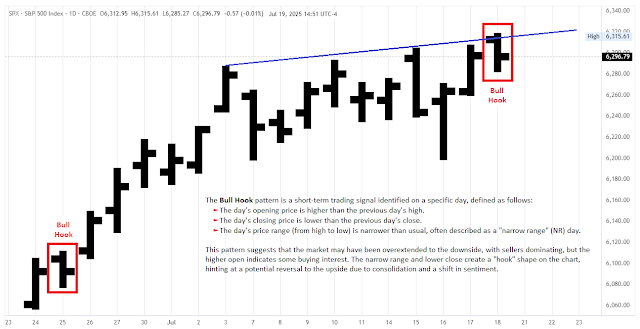
A Bull Hook occurs on Day 2. A Bull Hook is defined as a day with a higher open than the previous day's high followed by a lower close with a narrowing daily range. The next day (Day 1), a trade is taken on the initial move off the open, preferably to the upside.In other words: A Bull Hook occurs when you have an NR with the Open greater than the previous bar's High AND the Close less than the previous bar's Close.
Inside Day/Bar Narrow Range 4 = IDnr4
IDnr4 is an Inside Day (ID) with a Narrow Range 4 (NR4). This is a combination of an ID and an NR4. This happens when the current day's high is lower than the previous day's high AND the current day's low is higher than the previous day's low AND the range is the narrowest when compared to the previous 3 trading days.
2-Bar Narrow Range = 2BNR
If the 2-day-range (the higher of the 2 highs less the lower of the 2 lows) is the narrowest 2-day-range in the last 20 trading sessions then we are currently sitting on a 2BNR.
3-Bar Narrow Range = 3BNR
If the 3-day-range (the higher of the 3 highs less the lower of the 3 lows) is the narrowest 3-day-range in the last 20 trading sessions then this is true.
4-Bar Narrow Range = 4BNR
If the 4-day-range (the higher of the 4 highs less the lower of the 4 lows) is the narrowest 4-day-range in the last 30 trading sessions then this is true.
8-Bar Narrow Range = 8BNR
If the 8-day-range (the higher of the 8 highs less the lower of the 8 lows) is the narrowest 8-day-range in the last 40 trading sessions then this is true.
Reference:
See also:


