Showing posts with label Range. Show all posts

Friday, August 30, 2024

Re-Accumulation & Re-Distribution Range Patterns | Richard D. Wyckoff

 S&P 500 E-mini Futures (daily bars - May 23-August 30, 2024) — 40 Week Hurst Cycle Trough on August 5th.

S&P 500 E-mini Futures (4 hour bars - August 15-30, 2024) — Distribution or Re-Accumulation:
 
(1.) Accumulation, (2.) Mark Up, (3.) Distribution, (4.) Mark Down.

The Re-Accumulation process is exactly identical to the Accumulation process. The only difference between the two is the way the structure begins to develop. While the Accumulation range begins by stopping a bearish movement, the Re-Accumulation range begins after the stop of an upward movement. To put it another way: A Re-Accumulation occurs during a longer-term up trend, which will continue in the future. The main street is finally on the right side as well. Inside a Wyckoff Re-Accumulation schematic, buyers are closing parts of their long positions and sellers are joining the market. With the incoming selling positions, market makers can fill new long positions again.

 4 Types of Re-Accumulation Ranges a.k.a. Continuation Patterns a.k.a. Trend Continuation:
(1.) Re-Accumulation after a Decline.
(2.) Re-Accumulation with Spring Action.
(3.) Re-Accumulation after a Shakeout.
(4.) Re-Accumulation with an Uprising Structure.

The 4 Re-Distribution types are simply the opposite (lower 4 schematics):
(1.) Re-Distribution after a Rally.
(2.) Re-Distribution with Spring Action.
(3.) Re-Distribution after a Shakeout.
(4.) Re-Distribution with a Declining Structure.

 Examples of different types of Re-Accumulation Patterns in the Apple (AAPL) Weekly Chart.
 
The events and phases are still the same (see the Accumulation and Distributions Schematics - the last 4 charts). Only the beginning of the Re-Accumulation cycle is different and equals the start of a distribution cycle. Take a look at the Wyckoff distribution schematics below for the occurring events. The main events that differ from an accumulation or distribution cycle are the occurrences of the Creek. The Creek is a small trend over time and can equal a smaller consolidation. The Creek builds liquidity on both sides of the market and misleads market participants. The Jump Across the Creek (JAC) is the event that causes the SoS. The Jump Across the Creek does take out previous resistance lines with a strong up move. The Jump Across the Creek can also occur inside the trading range of the accumulation. The Creek can be the horizontal resistance defined by Phases A and B or an internal trend line that formed inside Phase B.
  • After the spring and test events, there is a bullish price move with momentum. This is called the Jump Across the Creek. Price continues with a bullish Phase E.
  • Usually, any shakeout and/or decline action before Re-Accumulation will have a local smaller distribution pattern (cause and effect).
  • The Initial Shakeout/Decline is less pronounced during Re-Accumulation than before Accumulation.
  • Volume: Re-Accumulation usually has less supply than Accumulation.
  • The maximum swing of trading range (highest to lowest point): Re-Accumulation trading range is usually tighter compared with an Accumulation trading range.
 (1.) Re-Accumulation after a Decline
 
  • Weakest among the Re-Accumulation types.
  • Decline usually starts from a small local distribution pattern.
  • It can have different variations of the trading range (see the structure of the next 3 formations).
(2.) Re-Accumulation with Spring Action
 
  • Flat or sloping down formation.
  • It can potentially have a few lower lows with a spring being the lowest point of the trading range.
  • Leading stocks can exhibit short-term weakness after strength in this formation.
(3.) Re-Accumulation after a Shakeout
 
  • Absorption of supply happens in the trading range without violation of support.
  • Usually and depending on a position of the market, this pattern exhibits strength.
(4.) Re-Accumulation with an Uprising Structure 
 
  • Re-Accumulation with an Uprise is the strongest Re-Accumulation type.
  • This structure will exhibit higher highs / higher lows.
  • Sometimes can be confused with a topping trading range (Distribution).
 
 
 Accumulation Schematic #1: Phases A and B.

 Accumulation Schematic #1: Phases C, D and E.
 
 Distribution Schematic #3: Phases A, B, C, D and E = the Inversion of the  Accumulation Schematic #1
 
The Re-Distribution occurs inside a markdown cycle and stops a down-trend for a longer period. After bigger price moves even Main Street joins the trend. Now it is time for the market makers to bring the price into a consolidation phase to scare sellers and bring in new buyers. That ensures new liquidity for the institution’s to place new short orders. The start of a Wyckoff Re-Distribution schematic is the same as an Accumulation cycle. A Creek inside the trading range creates liquidity on both sides of the market, which gets taken by a UTAD. Many people will see this as a break-out to join bullish price action, but don’t get fooled. With a Jump across the Creek, the price is not only returning into the trading range but going to continue the downtrend from before.
 
 
  Distribution Schematic #2: Phases A and B.
 
 Distribution Schematic #2: Phases C, D and E.
 
Many believe that simply labeling the events is sufficient for detecting Wyckoff cycles. Don't forget that a supposed Distribution can become a Re-Accumulation or an Accumulation a Re-Distribution. Therefore, it is essential to presuppose a fundamental market analysis and confirm a Wyckoff cycle with COT data, Seasonality, or other longer-term confirmations. Don't make the mistake of looking for Accumulations and Distributions in lower time frames. It is easy to draw a supposed accumulation on a 5-minute chart, but a real Accumulation takes place in higher time frames. Since a Wyckoff cycle takes time to unfold, wait for the events to occur and be fully validated. Otherwise, one quickly get s distracted by the noise within the actual moves and makes bad trading decisions in the worst case. 
 

Friday, August 23, 2024

Recent Toby Crabel Price Pattern Setups in the E-mini S&P 500 Futures


Wednesday, July 10, 2024

S&P 500 vs Tri-Annual, Yearly, Quarterly, Monthly, Weekly & Daily Pivot Levels

S&P 500 E-mini Futures (weekly candles) vs Tri-Annual Pivot Levels (for 2022-2024).
Based on spectrum analysis, Sergey Tarassov forcasted a multiyear high in US-stocks sometime 
around August 2024 between the crests of the 40 Month Cycle and the 42 Month Cycle
By then the tri-annual R1 level at 6,019 could well be reached. R2 is at 6,928.
 
S&P 500 E-mini Futures (weekly candles) vs Yearly Pivot Levels (for 2024).
Tri-Annual and Yearly Pivot Points and Levels are suitable for long-term investing or swing trading
with a time frame of several months to a year or more.

S&P 500 E-mini Futures (weekly candles) vs Quarterly Pivot Levels (for Q3 July-September 2024).
Quarterly Pivot Points and Levels are suitable for medium-term trading with a time frame of several 
weeks to a few months. They are useful for identifying intermediate support and resistance levels, 
trend continuations, and potential corrections.
.
S&P 500 E-mini Futures (daily candles) vs Monthly Pivot Levels (for (July 2024).
Monthly Pivot Points and Levels are ideal for short-term to medium-term trading 
with a time frame of several days to a few weeks.

S&P 500 E-mini Futures (daily candles) vs Weekly Pivot Levels (for July 07-12, 2024).
Weekly Pivot Points and Levels are suitable for short-term trading with a time frame of one to several
days to a week, to identify short-term support and resistance levels, trend continuations, and potential reversals.

S&P 500 E-mini Futures (4 hour candles) vs Daily Pivot Levels (for July 10, 2024).
Daily Pivot Points and Levels are ideal for short-term and intraday trading with a time frame of several hours to a day in order to identify short-term support and resistance levels, trend reversals, and potential breakouts. Daily Pivots can be used to make quick trading decisions, adjust stop-losses, or set price targets for the current trading session.
 

Pivot Points, Support and Resistance levels are calculated based on previous high, low, and close prices. These levels can identify areas, where price may bounce, reverse or break through, and where to set entry, stop-loss and take-profit orders. This technique is valid on various timeframes. Common types are Floor (Trader) Pivots a.k.a. Standard or Traditional Pivots (= all charts above), Central Pivot Range (CPR), Fibonacci, Woodie, Classic, Camarilla and DeMark Pivot Points, each type having their own calculation method.
 

See also:
Wednesday, June 26, 2024

2-Bar Narrow Range Setup | Toby Crabel

2-Bar Narrow Range (2BNRrepresents a condensation of the market concept called congestion or contraction. Contraction is subsumed within the market Principle of Contraction/Expansion which states that the market, having a specific nature, is constantly changing from a period of movement to a period of rest and back to a period of movement. This interchange between the phases of motion and rest are constantly taking place with one phase directly responsible for the other's existence. 2-Bar NR represents this market principle and provides a means of quantifying contraction in any market environment. This is possible because of the open-ended nature of the concept 2-Bar NR. 
 
 2-Bar Narrow Range (2BNR) in the S&P 500 on June 26, 2024.
If the 2-bar range is the narrowest range from high to low of any two day period relative to
any two day period within the previous twenty days, we are sitting on a 2BNR trading setup for June 27.

Because it is not dependent on a constant measurement it represents contraction in a volatile or narrow market period. In other words, contraction is a relative condition that can occur even in a volatile market. Once a market concept is formulated it is tradable. An ORB (Opening Range Breakout) trade is taken the day after the 2-Bar NR formed. An ORB trade is entered at a predetermined amount above or below the opening range (stretch), that is the range of prices that occur in the first 30 seconds to 5, 15 or 30 minutes of trading. 
 
The assumptions are that with a contraction of this type trending action would follow the direction of the breakout, and that because this pattern exhibits a more defined contraction that trending would take place over the next several days also. It is advantageous if the 2-Bar NR is holding at an important angle of support/resistance, including trendlines, when it is formed. Once the market has moved away from the open in one direction after a 2-Bar NR, it should not return to the opening price. If it were to do so, that would disqualify the day as a trend day. Trending action is ideal and is expected after the pattern.
 
Reference:

S&P 500 — Yearly, Quarterly and Monthly Floor Trader Pivots Levels

S&P 500 — Monthly Bars  — Yearly (2024) Pivots Levels:
R2  5,453  —  R1  5,110  —  MR1 4,781
Yearly Pivot Point (YPP)  4,551
MS1  4,280
  —  S1  4,108  —  S2  3,449

 S&P 500 — Weekly Bars  — Quarterly (Q2 2024) Pivots Levels:
R2  5,662  —  R1  5,546  —  MR1  5,258
Quarterly Pivot Point (QPP)  5,059
MS1  4,956
  —  S1  4,853  —  S2  4,456
 
 S&P 500 — Daily Bars  — Quarterly (Q2) and Monthly (June) Pivots Levels:
R2  5,558  —  MR2  5,490  — R1  5,423  —  MR1  5,319
Monthly Pivot Point  (PP) 5,215
MS1  5,147  —  S1  5,080  —  MS2  4,976  —  S2  4,872
 

Ref
erence:
 

Friday, June 14, 2024

The Principle of Contraction/Expansion | Toby Crabel

 
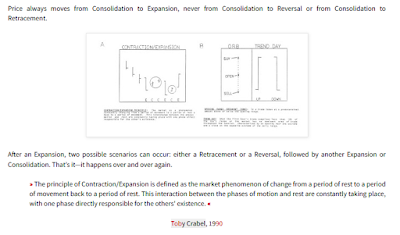
Price always moves from Consolidation to Expansion, never from Consolidation to Reversal or from Consolidation to Retracement. After an Expansion, two possible scenarios can occur: either a Retracement or a Reversal, followed by another Expansion or Consolidation. That’s it—it happens over and over again. 

» The principle of Contraction/Expansion is defined as the market phenomenon of change from a period of rest to a period of movement back to a period of rest. This interaction between the phases of motion and rest are constantly taking place, with one phase directly responsible for the others' existence. «
 
Toby Crabel, 1990
 
In his study 'Day Trading with Short Term Price Patterns and Opening Range Breakout' Toby Crabel defined the following range contraction and expansion patterns:

NR4 - The narrowest daily range relative to the previous three day’s daily ranges compared individually.
NR7 - A day with a daily range that is narrower than the previous six day’s daily ranges compared individually.
WS4 - (Widespread 4) A day with a daily range that is larger than any of the previous three day’s daily ranges.
WS7 - (Widespread 7) A day with a daily range that is larger than any of the previous six day’s daily ranges
             compared individually.

His key findings were: A cumulative total of Gross Profits for the contraction patterns vs expansion patterns on trades in the direction of the move off the open showed $710,000 for contractions on 7,313 trades and $102,000 for expansions on 7,524 trades. Profits were seven times larger for ORB (Opening Range Breakout) trades after contractions than expansions.

» Clearly something is going on here. The suggestion from these results is that one should be looking to go with a forceful move off the open after a contraction and not willing to do so after an expansion. In fact, fading price action off the open, with trend, after an expansion is a consideration. Other patterns can help with the decision on whether to fade a move off the open along with previously mentioned market context. If nothing else, one should be aware of the dangers of ORB trades the day after a big directional day. Caution is necessary after expansions. This is when the most attention is given to the market by the novice trades who invariably get caught in whipsaws and trendless markets. «  

Bitcoin - Inside Bar Narrow Range 4 (ID/NR4)
in monthly, weekly, daily and 4 hour bar charts.

» An object at rest stays at rest and an object in motion stays in motion with the same speed 
and in the same direction unless acted upon by an unbalanced force. «
Isaac Newton's 'First Law of Motion', 1687
 

Friday, May 31, 2024

Broadening Formations & The Third Universal Truth | Robert F. Smith

The Third Universal Truth is this: There is only ONE price pattern. Everything trades in a continuous series of broadening formations because there are only three scenarios that can possibly play out from one bar to the next. Therefore only THREE types of bars exist: the Outside Bar, the Inside Bar, and the Directional Bar. It is impossible for price to do anything else. Range expansion on both sides occurs ONLY because Outside Bars exist. 

Broadening Formation on quarterly, monthly, weekly, and daily Apple Inc (AAPL) charts.
Inside Bar = 1 | Directional Bar = 2 | Outside Bar = 3

Almost every book on technical analysis claims that the broadening formation is extremely rare, when the truth is it is one of the only things that can possibly happen. A broadening formation is a pattern where ranges continue to expand on both sides, thus an outside bar is a broadening formation when you shorten the time frame of the chart. It must be because by definition the range is expanding on both sides. While many traders will talk about stocks making higher lows and lower highs, one thing is that securities will always trade in a series of higher highs and lower lows. Even if a stock is in a steady uptrend from, say, $80 to $100, somewhere along the way that stock will make a series of higher highs and lower lows on some time frame. 
 
 Basic Diagram of the Broadening Formation.

While this may seem irrational, it helps to analyze this statement from the perspective of supply and demand. When a stock reaches a new high, it means that a new group of buyers have been identified above the previous high. Eventually, that buying pressure exhausts, and the stock retreats. This new group of buyers becomes trapped, and this will create pressure to the downside, either on a short-term time frame or a long-term time frame. Inevitably, the stock will eventually get pushed towards a previous low, whether it's a recent low on a 15 minute chart or a major inflection point on a monthly chart. As the stock pushes towards this low, those buyers at highs will succumb to the selling pressure, drive the stock to a new low that is bought up by the sideline traders or natural buyers, and the stock will resume higher until it reaches the next new high. This series repeats itself, which creates a formation that can be fit into a triangle.
 
 Nasdaq (Daily Bars)
Inside Bar = 1 | Directional Bar = 2 | Outside Bar = 3
Every chart shows but Broadening Formations, nested series of Range Contractions and Range Expansions
on yearly, quarterly, monthly, weekly, daily and lower time frame charts. Full Time Frame Continuity occurs when all time frames point in the same direction, providing a more reliable assessment of the market's direction.

Nasdaq (4 Hour Bars)
Inside Bar = 1 | Directional Bar = 2 | Outside Bar = 3
 
Broadening Formations = ICT Seek & Destroy Profile
 
How to find a Broadening Formation?
  1. Identify an Outside Bar on a Higher Time Frame.
  2. Remember an Outside Bar takes out BOTH sides of the previous bar's range. This is how we gauge the potential magnitude of an expected move.
  3. An Outside Bar = A Broadening Formation on a Lower Time Frame chart. This is a FACT. Ignore previous Technical Analysis textbooks.
  4. Locate the High of the Outside Bar and DRAW BACK to a previous Higher High (HH Point #1 to #2). Generally try and use an extended line type drawing tool on your charting software as this will extend the line forward.
  5. Locate the Low of the Outside Bar and DRAW BACK to a previous Lower Low (LL Point #1 to #2).
  6. View the same chart on a Lower Time frame and watch the magic happen. Now you have a Broadening Formation.
  7. Note depending on your charting software you may have to adjust your lines at key high and low points when switching between different time frame charts this is normal and due to the difference in candlesticks between timeframes.
Reference:
 
 Robert Franklin 'Rob' Smith (1964-2023).
Life and death of a sporty American reborn Christian trader. R.I.P.
 
#TheStrat Setups with Entry, Stop and Target Levels. 
#TheStrat Risk/Reward Ratios are mostly sub-optimal.
ICT Optimal Trade Entry (OTE) strategies do improve poor #TheStrat RR-Ratios significantly.
 
28 #TheStrat Setups = 14 bullish + 14 bearish. 
 Inside Bar = 1 | Directional Bar = 2 | Outside Bar = 3