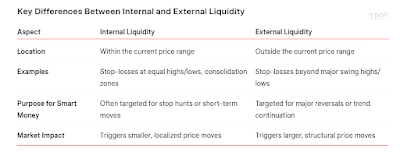
This strategy focuses on how price reacts to liquidity and volatility during the trading day. Liquidity refers to the areas on a chart where other traders have placed stop-loss orders, usually just above recent highs or just below recent lows. The market often moves into these areas to trigger those stops, and then either reverses sharply or continues strongly in the same direction.
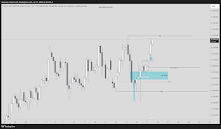
Trade Example - NQ Short (1-H Chart)
The goal of this strategy is to spot those liquidity grabs, wait for a clear reaction, and then enter with confidence—either to trade the reversal or the continuation. The method is built for traders who prefer to focus on one trading day at a time, using clear logic, session structure, and precise timing.
On this episode of Chart Fanatics we are joined by Kyle Ng (AKA Jadecap). Regarded as ICT's best student and recently achieved a world record payout with Apex. Kyle reveals his complete ICT playbook that allowed him to generate millions from the markets. In this episode you'll learn how to manage open exposure and lock in profits, how to predict the next daily candle and the psychology behind avoiding greed in a trade. Riz Iqbal, May 15, 2025.
Each trade begins with a daily bias: a simple outlook on whether price is likely to move up or down today. Then the trader watches for session liquidity raids (like the Asian or London session highs/lows being taken out), and enters only after confirmation appears through a fair value gap, market structure shift, or divergence between markets. This model works well for intraday trades but can also be used for swing trades when the higher time frame aligns with the setup.
To take a trade using this model, the following must be true:
Clear Daily Bias: Decide if you’re bullish or bearish for the day using the daily chart.
Consider recent highs, lows, inefficiencies, and where the price is likely to go next.
Session Liquidity Zones Marked: These are common stop zones and entry traps:
Previous Day’s High and Low
Asian Session High/Low
London Session High/Low
Wait for a Liquidity Raid: A key session level must be taken out during the New York session — this is your signal
that stop orders have been hit and a potential move is beginning.
Confirmation on Lower Time Frame (15m / 5m). After the liquidity raid, wait for one of these confirmations:
Ideal Time Window
Trade setups should form between 9:30 and 11:30 AM EST/EDT.
Target & Exit: Your target depends on the setup type. Intraday Targets: Opposite session liquidity, fair value gaps, or equal highs/
lows. If the trade slows near midday, consider exiting even before the full target is reached.
Swing Targets: Use higher time frame liquidity zones (daily/weekly highs or lows), imbalances, or major structure. Swing trades can be held for multiple days as long as the bias and structure support it. Use time-of-day awareness, price behavior, and your risk profile to decide whether to hold or exit early.
Pros & Cons of the Strategy
This model is designed to deliver high quality, repeatable setups — but like any trading method, there are key things to understand before using it. Note: The cons listed here aren’t disadvantages. They are things to be aware of — important characteristics that require patience, discipline, and proper management to make the model work effectively.
Trade Example - NQ Short (15-Min Chart)
Reference:
If markets continually trend higher, any run on short-term highs should only be seen as short term liquidity being taken. Any retracement lower should be framed as a return to internal range liquidity prior to continuation.This keeps you on the RIGHT side of the market and you stop anticipating major reversals. Never try to pick tops and bottoms. Leave that to the big boys. We only want to ride their coattails. JadeCap's Trading Room, July 16, 2025.
I stopped adding new concepts and tools and just focused on properly executing what I've already learned. A few lines, context, and ironclad risk management. Stop focusing on the P&L and the size of your trades. If you can trade 1 micro you can trade 10 minis. But you can't do that at scale without a solid PROCESS. JadeCap's Trading Room, July 17, 2025, 14:47.

%20conv%2020.png)


