August was the best DJIA month from 1901–1951, driven by agriculture and farming. Since 1988, however, it has become the worst month for DJIA and Russell 2000, and the second worst for S&P 500, NASDAQ, and Russell 1000, with average returns from +0.1% (NASDAQ) to –0.8% (DJIA). In August 2022, all major indexes fell over 4%; in 2023, losses exceeded 1.8%.
Down from August 4 (Mon) into August 19 (Tue), mid- to late-month sideways to down, up into month end.
The S&P 500 rises steadily through July (blue STA Aggregate Cycle),
peaks in early August, and pulls back into late August.
peaks in early August, and pulls back into late August.
In
post-election years, August has been even weaker: it’s the worst month for DJIA
and Russell 1000, second worst for S&P 500, NASDAQ, and Russell
2000. Average losses range from –0.5% (Russell 2000) to –1.5% (DJIA),
with more down Augusts than up across all indexes.
Reference:
Jeffrey A. Hirsch (July 28, 2025) - Typical August Trading – Better Open in Post-Election Years but Still Historically Weak.
Jeffrey A. Hirsch (July 25, 2025) - August has been even weaker in post-election years.
Jeffrey A. Hirsch (July 25, 2025) - August has been even weaker in post-election years.
Bank of America (BoA) analyst Paul Ciana highlights a historical S&P 500 trend since 1928, where the average trend tended to be frontloaded in July, peaking by the end of August and correcting lower in September. However, since 2015 a similar pattern with a mid-August peak developed while the median trend sees a late September peak.
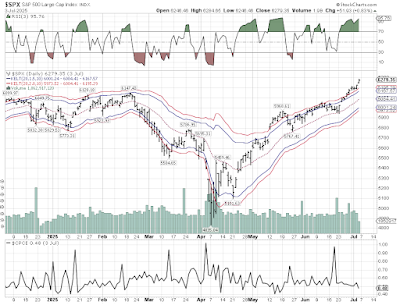
The summer doldrums (late June to early September) typically see 20-40% lower trading volumes and variable volatility due to reduced market participation. Equities, bonds, commodities, and forex show subdued activity, with occasional volatility spikes due to low liquidity, and, in August 2025, possibly from more US tariffs craze and geopolitical events.
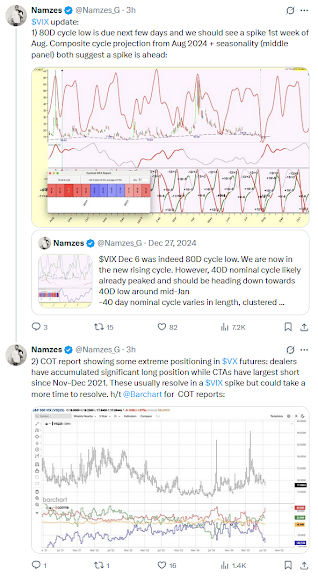
The latest Commitment of Traders (COT) report (see above) reveals extreme positioning in VIX futures, with dealers (= banks, broker-dealers, intermediaries managing risk from client trades, not speculating) holding substantial long positions and CTAs (= hedge funds, who are on the other side of the trade, typically as speculators) showing their largest short exposure since November–December 2021—a pattern that has frequently preceded spikes in the VIX. This unusual market setup suggests potential volatility in early August 2025 and aligns with Namze's forecast of an 80-day cycle low in the VIX during that period. However, the resolution may be delayed due to the scale of the positioning.
(1928-2024) peaks in July and falls around 8% by year-end.
A seasonal cycle analysis by Ned Davis Research on the 2025 S&P 500 composite—blending the standard seasonal, 4-year Presidential, and 10-year decennial cycles—projects a current peak, choppy action through October, a late-year drawdown,
and a strong Q4 rally. August and September appear as potential weak spots.
See also:


