Within the four-year presidential cycle, the midterm year represents the weakest phase for equities. It is characterized by low single-digit average returns and the cycle's deepest intra-year pullbacks. However, it also sets the stage for the most reliable and profitable recovery rallies, which typically extend well into the following year. Historical data on years ending in "6," dating back to 1806, show that 85% closed higher, with only four instances of declines. Hurst cycles project 9-month troughs for January and October 2026 (as illustrated in the charts at the end of this article).
The first chart above shows the average seasonal performance of the DJIA (blue), S&P 500 (black), NASDAQ (green), and Russell 2000 (grey) from 1949 to 2024. All follow a consistent trajectory: a period of weakness from January through September, with average cumulative declines of 2–8%, followed by a fourth-quarter recovery that pushes annual returns toward positive territory.
The Dow Jones Industrial Average could easily rally almost 50% from the 2026 low to the high of 2027. On average it does. Data spanning back to 1914 reveals that the Dow Jones Industrial Average sees an average climb of 46.3% from its lowest point in a midterm year to its peak in the ensuing pre-election year. To put that growth into perspective with current market values, a jump of that size would be comparable to the index rising from 40,000 to nearly 60,000.
The next chart focuses on the S&P 500, comparing the broader midterm average (blue) against the sixth year of a presidency (red), second-term Republican midterms (green), and Jeffrey A. Hirsch's Stock Trader’s Almanac aggregate cycle (black). Across all categories, early-year gains eventually yield to mid-year volatility, and a strong rally consistently emerges from October onward.
The second-term Republican midterm cycle (green) begins with a minor January dip, followed by a steady ascent that peaks at roughly 6-8% by April-June. After third-quarter volatility—where gains typically compress to a 1% floor in September—the market enters a year-end rally exceeding 8% by December.
Performance of the S&P 500 during the Presidential Cycle:
Midterm Years see both the largest pullbacks, and the best recovery rallies.
Midterm Years see both the largest pullbacks, and the best recovery rallies.
S&P 500 Peak-to-Trough Declines in Midterm Election Years, 1950-2022.
The table above outlines every S&P 500 peak-to-trough decline during midterm election years between 1950 and 2022. These declines averaged 17.3% over 115 calendar days, typically beginning in late April and finding a floor by mid-August. However, all of these declines consistently acted as springboards, fueling recovery rallies that averaged 31.7% gains one year later.
» In the VI years there is a noticeable tendency to form a saddle.
February or March is without exception higher than some subsequent
month between May and August inclusive; but also without exception
November is higher than March. «
February or March is without exception higher than some subsequent
month between May and August inclusive; but also without exception
November is higher than March. «
J.M. Hurst's 18-Month Cyclic Model: Component cycles
and the aggregated Composite Cycle (thick black line).
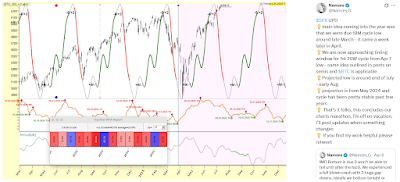
While the ideal period for Hurst’s nominal 40-week cycle (also known as the 9-month cycle) is 272 days (38.86 weeks), current data from TimeSeriesSCC and Sentient Trader indicate a shorter realized average in the S&P 500 and NASDAQ. Over the last ten iterations, the measured 40-week cycle has averaged 257 to 262 days (36.7 to 37.4 weeks).
Projecting this duration forward from the major troughs of April 7 and April 21, 2025, the next 40-week cycle trough was initially expected to occur in a window between December 20, 2025, and January 8, 2026. However, considering the recent 80-, 40-, and 20-day troughs—including those from the DJI, NDX, ASX, DAX, NIFTY, and BTCUSD—shifts the projected window toward mid-late-January.
Gold, Midterm Year Seasonal Pattern (1975-2024).
Silver, Midterm Year Seasonal Pattern (1973-2024).
Copper, Midterm Year Seasonal Pattern (1973-2024).
Crude Oil, Midterm Year Seasonal Pattern (1984-2024).
Natural Gas, Midterm Year Seasonal Pattern (1991-2024).
See also:
Larry Wiliams (December 23, 2025) - 2026 Market Forecast: Cycles, Risks, and Opportunities.


.PNG)


.PNG)


