Wednesday, July 10, 2024

S&P 500 vs Tri-Annual, Yearly, Quarterly, Monthly, Weekly & Daily Pivot Levels

S&P 500 E-mini Futures (weekly candles) vs Tri-Annual Pivot Levels (for 2022-2024).
Based on spectrum analysis, Sergey Tarassov forcasted a multiyear high in US-stocks sometime 
around August 2024 between the crests of the 40 Month Cycle and the 42 Month Cycle
By then the tri-annual R1 level at 6,019 could well be reached. R2 is at 6,928.
 
S&P 500 E-mini Futures (weekly candles) vs Yearly Pivot Levels (for 2024).
Tri-Annual and Yearly Pivot Points and Levels are suitable for long-term investing or swing trading
with a time frame of several months to a year or more.

S&P 500 E-mini Futures (weekly candles) vs Quarterly Pivot Levels (for Q3 July-September 2024).
Quarterly Pivot Points and Levels are suitable for medium-term trading with a time frame of several 
weeks to a few months. They are useful for identifying intermediate support and resistance levels, 
trend continuations, and potential corrections.
.
S&P 500 E-mini Futures (daily candles) vs Monthly Pivot Levels (for (July 2024).
Monthly Pivot Points and Levels are ideal for short-term to medium-term trading 
with a time frame of several days to a few weeks.

S&P 500 E-mini Futures (daily candles) vs Weekly Pivot Levels (for July 07-12, 2024).
Weekly Pivot Points and Levels are suitable for short-term trading with a time frame of one to several
days to a week, to identify short-term support and resistance levels, trend continuations, and potential reversals.

S&P 500 E-mini Futures (4 hour candles) vs Daily Pivot Levels (for July 10, 2024).
Daily Pivot Points and Levels are ideal for short-term and intraday trading with a time frame of several hours to a day in order to identify short-term support and resistance levels, trend reversals, and potential breakouts. Daily Pivots can be used to make quick trading decisions, adjust stop-losses, or set price targets for the current trading session.
 

Pivot Points, Support and Resistance levels are calculated based on previous high, low, and close prices. These levels can identify areas, where price may bounce, reverse or break through, and where to set entry, stop-loss and take-profit orders. This technique is valid on various timeframes. Common types are Floor (Trader) Pivots a.k.a. Standard or Traditional Pivots (= all charts above), Central Pivot Range (CPR), Fibonacci, Woodie, Classic, Camarilla and DeMark Pivot Points, each type having their own calculation method.
 

See also:

Thursday, July 4, 2024

Structural Characteristics of Bullish & Bearish Months | D'onte Goodridge

Traders want to find trending markets but often fail to see and understand the structural characteristics of bullish and bearish months. Both move in a similar fashion but inverse to one another. Here are the characteristics for the formation of a bullish month:
 
 
The first example is a daily chart of US Dollar versus Japanese Yen (USDJPY) during February 2023. The market was trending up. It was a bullish month. Let's identify the five key factors to a bullish month:

1. Price moves below the monthly opening price.
2. A swing low forms below the month's open.
3. Price purges a previous daily low (PDL) and reverses back to a previous daily high (PDH).
4. The market creates a market structure shift (MSS) to the upside and an Imbalance or Fair Value Gap (FVG).
5. Higher swing highs and higher swing lows form.
 

Looking at the daily candles in the USDJPY chart, we see the methodical sequence of a Bullish Month developing:
 
1. Price was movesg below the monthly opening price. Price stops below it, runs up, drops below it, runs up and continues the bullish trend.
2. A swing low below the month's open forms. This is a swing low because the candle on the left has a higher low and the candle on the right has a higher low, hence the low in the middle is the lowest point. To form a swing low  only takes three bars.
3. Price purges a previous low and works back to a previous high. The following day price reverses back to the previous daily high, all happening within a three bar setup, creating a swing low, which is a purge on the previous daily low and a reversal back to a previous daily high.
4. Next the market creates a shift to the upside with speed through a previous swing high and a FVG.
5. And price created a new swing high and a higher swing low.

The next example is a daily chart of Apple during January 2023. The same five criteria for a Bullish Month were met:
 

Now let's look at the five key factors to a Bearish Month:

1. Price moves above the monthly opening price.
2. A swing high forms above the month's open.
3. Price purges a previous daily high and reverses back to a previous daily low.
4. The market creates a shift to the downside and a FVG.
5. Lower swing highs and lower swing lows form.
 

The first example is a daily chart of British Pound versus US Dollar during August 2022. The market was trending down. Identify the above listed five criteria for the formation of a Bearish Month:
 
 
The last example is a daily chart of Gold during February 2023. Gold was in a down trend. Identify the structural criteria for the formation of a Bearish Month:


Tuesday, July 2, 2024

The Oops! Reversal Setup | Larry Williams

One of Larry Williams’ best-known setups is called Oops!: We are waiting for the market to open. We take as a reference the daily bar of yesterday, with its open, evolution and close. When the market opens, suppose a gap up occurs. A gap up takes place when the open is higher than the highest point that was reached on the previous day; a gap down occurs when the open is lower than the lowest traded point of the previous day.


When a market opens at a very high level and there is a gap up, it is very strong. So, we obviously suppose that it goes up. It will probably do it but, if for some reason it starts to fall and then reaches the highest level of yesterday, it is as if it said: "Oops!, I was wrong. I’m not strong, but weak." In this case, we open a short position at this level. We enter short because we imagine that the market (and the players in the market) realizes it isn’t that strong. Actually, the market is weak, so it will go down. 

To use this setup, we obviously need a stop-loss whose size depends on the market we are trading. How do we close this position? Larry Williams proposed a bailout exit he called "first profitable open". This consists in staying in the position until, on the following day or days, the market opens somewhere below the entry level (because we are short). When that happens, we close the trade. So, we keep the position until we get the profit or, obviously, when we are stopped out. We can also close the position at the end of the same day. The one suggested by Larry Williams is however the best one, although it sounds quite weird. Believe me, the first profitable open is a very effective close of the position.
 
This is the basic version of the Oops! Anyway, I know Larry Williams made some tweaks to it. The Oops! works, but today this specific setup is quite rare. The reason is that many markets trade for 23 hours a day now. So, it’s quite hard to have a heavy gap in just one hour. Maybe, you can have one after the weekend, but normally it’s not there.

Monday, July 1, 2024

Buy & Sell Signals | Larry Williams

 Buy Signal: Dump, dump, (dump), go sideways and pump a bit, one more small dump, then the pump.
Sell Signal: Pump, pump, (pump), go sideways and drop a bit, one more small pump, then the dump.

»  If I've seen prices in a big downtrend, they move sideways, then drop again, but immediately come back up, back into that trading range, that's a buy signal. Why? Because during that trading range, there was accumulation going on. The fact that it broke down fills a lot of long positions. Professional money will buy there, and if it immediately comes back, then that nails it. They've been buying and I want to get long the market.  «

 
See also:

Saturday, June 29, 2024

How fast Superpowers can Collapse

In early 1991, Soviet citizens voted on the New Union Treaty which proposed to reform-rather than dissolve-the USSR. 76% of Soviet voters ultimately supported maintaining the federal system of the Soviet Union, including a majority in nine of the 15 republics. A year later, however, the USSR didn’t exist.
 
 
In 2021, in the US an astonishing 66% of Southern Republicans and 50% of independents were in favor of secession. The West Coast also showed strong support for secession but of a different political flavor, this time being mostly supported by Democrats.

Friday, June 28, 2024

July 4th Bullish Pre-Holiday Trade, Bearish After | Jeff Hirsch

Trading the three days ahead of the July 4th Independence Day holiday has historically been stronger than the days after the holiday. Trading on the day before and after the holiday is often lackluster. Volume tends to decline on either side of the holiday as vacations begin early and/or finish late. Since 1980, DJIA, S&P 500, NASDAQ and Russell 2000 have recorded net losses on the day after.


This has become more pronounced in recent years and was the case again last year. However, over the past thirteen years since 2011, trading after Independence Day has softened notably. DJIA has declined ten times in 13 years on the day after. S&P 500 has slipped eight times. Average performance remains fractionally positive. NASDAQ and Russell 2000 have more up days after the 4th but R2K averages losses the two days after the 4th.


Jul
y Best S&P & NASDAQ Month Last 21 Years - nearly all gains in first 13 trading days | Jeff Hirsch
 

A Remake of Beavis and Butt-Head | Alexander Dugin

American democracy is like an episode of Beavis and Butt-Head. In the 1990s, the animated cartoon 'Beavis and Butt-Head' directed by Mike Judge was popular in the United States and Russia. Its heroes were two mentally retarded American teenagers, swearing profanely at each other, expressing one absurd thought after another, unable to solve any domestic situation, but despite their complete uselessness and senselessness, somehow coping with life.   
 
 » The USA is a crazy teenager with a loaded rifle. «

Whenever a series of idiotic actions brought them to the brink of total disaster, an equally ridiculous accident or a breakdown in the logic of things saved them, giving them another chance. Which they immediately squandered, however. And everything repeated in a circle. Failure after failure, eating worms, completely wrong decisions, breaking all possible logical connections, and in the end watching a heavy metal video in which horned men with guitars stage-managed to eat women or live goats.  
 
What the world saw during the election debate between Trump and Biden was just a fresh episode of Beavis and Butt-Head. And both of them somehow look as if they were drawn from cartoon characters: Trump is a remake of Beavis, Biden is a remake of Butt-Head. Trump even has the exact same hairstyle. And the content of the debate is completely in the spirit of the show. Trump seems an order of magnitude more sane than Biden. Even his most ardent opponents have recognised this. It is telling that this time the Democrats did not flood the media with victory speeches about Joe's crushing victory over the despicable fringe fascist. 
 

Trump dealt a blow to the Kiev Nazi junta: he directly called Zelensky a thief and a crook and confirmed that Ukraine has already lost and that the Russians are about to conquer it.
The only thing left to do wrong is to put Trump on the Ukrainian terrorist website 'Myrotvorets' and start writing songs about how he is an agent of Mordor. This is a crucial moment in the war. It is very important to analyze the further development of the election campaign in the USA. Joe is back in hospital and the Democrats will now do something about it. In essence, Trump in this debate won the election before it began. This much is clear for all to see. Now, anything can be expected. 
 

[...] If such a society and such a culture, such candidates and such voters determine the fate of humanity, then we have to admit that we are finished. It is impossible to think of treating or applying developmental techniques to a clinically ill teenager if he has a nuclear button in his hands. We say that Russia is ruled by God, because otherwise its existence is inexplicable. America has some mystery as well. How is it possible to become the most important world power on such grounds, with such people and with such mental problems? It means that it is ruled by someone more serious and invisible. And it doesn't look like God. Rather, someone else.


» All red lines were breached. The time of proxy wars is over. We are prepared for a world war.
Russia will provide all the enemies of the West with everything they need, including nuclear weapons. « 
Alexander Dugin on the escalation of the US and Russia towards totally uncontrolled World War III
and on Donald Trump as the potential savior of humankind
.

Wednesday, June 26, 2024

2-Bar Narrow Range Setup | Toby Crabel

2-Bar Narrow Range (2BNRrepresents a condensation of the market concept called congestion or contraction. Contraction is subsumed within the market Principle of Contraction/Expansion which states that the market, having a specific nature, is constantly changing from a period of movement to a period of rest and back to a period of movement. This interchange between the phases of motion and rest are constantly taking place with one phase directly responsible for the other's existence. 2-Bar NR represents this market principle and provides a means of quantifying contraction in any market environment. This is possible because of the open-ended nature of the concept 2-Bar NR. 
 
 2-Bar Narrow Range (2BNR) in the S&P 500 on June 26, 2024.
If the 2-bar range is the narrowest range from high to low of any two day period relative to
any two day period within the previous twenty days, we are sitting on a 2BNR trading setup for June 27.

Because it is not dependent on a constant measurement it represents contraction in a volatile or narrow market period. In other words, contraction is a relative condition that can occur even in a volatile market. Once a market concept is formulated it is tradable. An ORB (Opening Range Breakout) trade is taken the day after the 2-Bar NR formed. An ORB trade is entered at a predetermined amount above or below the opening range (stretch), that is the range of prices that occur in the first 30 seconds to 5, 15 or 30 minutes of trading. 
 
The assumptions are that with a contraction of this type trending action would follow the direction of the breakout, and that because this pattern exhibits a more defined contraction that trending would take place over the next several days also. It is advantageous if the 2-Bar NR is holding at an important angle of support/resistance, including trendlines, when it is formed. Once the market has moved away from the open in one direction after a 2-Bar NR, it should not return to the opening price. If it were to do so, that would disqualify the day as a trend day. Trending action is ideal and is expected after the pattern.
 
[Crabel's ORB system doesn't work in today's markets. Different entry criteria need to be applied.]

Reference:

S&P 500 — Yearly, Quarterly and Monthly Floor Trader Pivots Levels

S&P 500 — Monthly Bars  — Yearly (2024) Pivots Levels:
R2  5,453  —  R1  5,110  —  MR1 4,781
Yearly Pivot Point (YPP)  4,551
MS1  4,280
  —  S1  4,108  —  S2  3,449

 S&P 500 — Weekly Bars  — Quarterly (Q2 2024) Pivots Levels:
R2  5,662  —  R1  5,546  —  MR1  5,258
Quarterly Pivot Point (QPP)  5,059
MS1  4,956
  —  S1  4,853  —  S2  4,456
 
 S&P 500 — Daily Bars  — Quarterly (Q2) and Monthly (June) Pivots Levels:
R2  5,558  —  MR2  5,490  — R1  5,423  —  MR1  5,319
Monthly Pivot Point  (PP) 5,215
MS1  5,147  —  S1  5,080  —  MS2  4,976  —  S2  4,872
 

Ref
erence:
 

Are We Due For A Little Mean Reversion? | Jeff Hirsch

I remain bullish on 2024. My 2024 Annual Forecast released on December 21, 2023 is on track, yet the market has already achieved (and slightly surpassed) my Base Case Scenario of average election year gains of 8-15%. While my Best Case Scenario of 15-25% is likely now in play with the market running well above any of the historical seasonal patterns I can concoct, the market may be due for a little reversion to the mean.


The charts here illustrate the three most relevant seasonal patterns: All Election Years, election years with a Sitting President Running for reelection and my STA Aggregate Cycle, which is a combo of all years, election years and the 4th year of the decade (years ending in 4). The Midyear Rally I discussed early this week is still in play. But after that around mid-July, I would not be surprised if the market were to pull back toward the mean a bit, maybe 5-8%.

There is plenty on the near-term horizon to spook traders from election campaign and political missteps, to Fedspeak, economic data disappointments and just plain old Summer Doldrums. 

Quoted from:
 
See also:

2024 DJIA Compared to 40-Month and 42-Month Cycles | Sergey Tarassov

Tuesday, June 25, 2024

High in US-Stocks July 3-5 and Small Pullback into July 14-26 | Allen Reminick

Today is June 24th. The market is still very bullish. I am looking for a small pullback starting around July 3rd or July 5th-9th lasting into July 14th-26th. Another rally - possibly to new highs - into late August should follow before a 5 to 10 percent correction into early October and potentially into the US election around November 5th or 6th.


After the election I expect the market going up again at least to the end of 2024 and potentially into May or August of 2025. If the high came in now in July-August, it would be about 5,700; if it comes in next year, it could be way higher than 6,000.

Monday, June 24, 2024

Nasdaq’s Midyear Rally from around June 26 to July 12 | Jeff Hirsch

In the mid-1980s tech’s influence in the market began to grow and the market’s focus in early summer shifted to the outlook for second quarter earnings of technology companies. In anticipation of positive results, over the last three trading days of June and the first nine trading days in July, NASDAQ typically enjoys a rally. 
 

This 12-day run has been up 30 of the past 39 years with an average historical gain of 2.5%. Look for this rally to begin around June 26 and run until about July 12.


After the bursting of the tech bubble in 2000, NASDAQ’s mid-year rally had a spotty track record from 2002 until 2009 with three appearances and five no-shows in those years. However, it has been quite solid over the last fourteen years, up twelve times with two losses. After struggling in the bear market of 2022, NASDAQ resoundingly rebounded last year to gain 4.1% compared to a total July gain of 4.0%.

See also:

Thursday, June 20, 2024

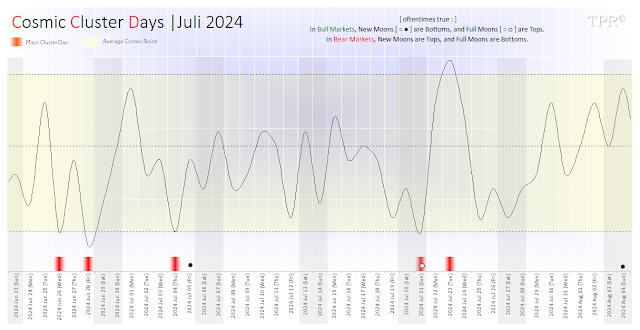
Cosmic Cluster Days | July 2024

 Cosmic Cluster Day  |   Composite Line Cosmic Noise Channel
○ = Full Moon | ● = New Moon

C
osmic Cluster Days and financial markets have no consistent fixed polarity nor directional bias. Nonetheless, swing directions, highs and lows 
— also inside of the 'noise channel'  — may correlate or coincide with financial market directions and reversals. 
 
Upcoming Cluster Days are: 
 
Jun 26 (Wed)
Jun 28 (Fri)
Jul 04 (Thu)
Jul 21 (Sun)
Jul 23 (Tue)
Aug 19 (Mon)
 
Cosmic Cluster Days during May - June 2024 HERE
 
More background information on the original author, the concept and calculation of Cosmic Cluster Days  HERE.
 
Jack Gillen's Sensitive Degrees of the Sun for the NYSE during July 2024:

2024 06 29 (Sat) = SUN @ 8 CAN = 98 degrees = high
July 04 (Thu) = SUN @ 13 CAN = 103 degrees = low
July 07 (Sun) = SUN @ 16 CAN = 106 degrees = high
July 10 (Wed) = SUN @ 18 CAN = 108 degrees = low
July 24 (Wed) = SUN @ 2 LEO = 122 degrees = low
July 29 (Mon) = SUN @ 6 LEO = 126 degrees = high
2024 08 09 (Fri) = SUN @ 17 LEO = 137 degrees = low 

No turning points in the Geocentric Bradley Barometer during July 2024.
 
The SoLunar Rhythm in July 2024.