Wednesday, August 26, 2015

Monday, August 24, 2015

The Chart Whisperer Exlaining the Nature of this Crash

HERE
HERE

HERE

HERE

Shipping Indices Reflecting Real Economy

Baltic Dry Index (HERE)
These days shipping indices like the Baltic Dry Index (BDIY) and the Shanghai Containerized Freight Index (SCFI) are the only real economic indicators not manipulated. They do not implode without larger malfunctions under the surface of the financial system. Oil, exports and manufacturing do not crumble without the weight of greater disaster bearing down.

The BDI is the main sea freight index at the Baltic Exchange for ships carrying dry bulk commodities. The BDI peaked out at 1,222 in early August and continued to drop to 994 points last Friday, mainly due to weak panamax rates. The overall index factors in average daily earnings of capesize, panamax, supramax and handysize dry bulk transport vessels. 


Shanghai Containerized Freight Index (HERE)
Data from the SCFI shows that shipping freight rates for transporting containers from ports in Asia to Northern Europe also dropped more than 20% since early August down to $ 674.54 per 20-foot container (TEU) last Friday. Freight rates on the world's busiest shipping route have tanked this year due to overcapacity in available vessels and sluggish demand for transported goods. Rates generally deemed profitable for shipping companies are at about US$800-US$1,000 per TEU.

U.S. Energy Consumption since 1776

Credits: EIA

Saturday, August 22, 2015

SPX vs Mercury Speed

SPX vs AstroMetric Indicator

Based on a natal-chart approach. Short-term inversions occur; longer-term the indicator tends to nicely project market directions.
Astrology has what some call the rule of three. This says that for an astrological prediction to be true, one must be able to see
it expressed three ways. If one sees it once it is only a possibility, if one sees it twice, it becomes more likely, but if one can
see the same theme a third time, the prediction becomes a probability.

Eurodollar COT Signals Big Drop in Stocks Still Ahead | Tom McClellan

Credits: Tom McClellan

DJIA 2015 vs DJIA 2008

Calculated and charted with Timing Solution. For the methodology see HERE

DJIA 2015 vs DJIA 1885

Calculated and charted with Sergey Tarassov's Timing Solution. For the methodology see HERE

Thursday, August 20, 2015

Wednesday, August 19, 2015

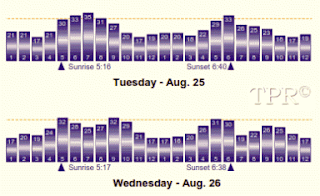
SoLunar Intraday Maps - August 2015

The charts show the hourly solunar forces over Wall Street. Intraday movements of financial markets are strongly influenced 
by daily and intraday solunar forces. They usually closely follow their direction - either directly or inverted. Turning points can
be fine-tuned using the previously described planetary hours as well as the times of rising, culminating and setting planets.
Please note: The times calculated refer to EST (not EDT).
HERE

Saturday, August 15, 2015

The Demographic Crash of Civilizations

The current world population of 7.3 billion is expected to reach 8.5 billion by 2030, 9.7 billion in 2050 and 11.2 billion in 2100, according to the latest UN-World Population Report. However, the most important development of the twenty-first century is likely to be the great extinction of peoples, nations, cultures and civilizations. The so called ‘developed world’ is failing to attend to the most elementary task of any successful civilization: raising children. Civilization, culture, social harmony and economic prosperity rest upon the indispensable pre-condition of simple physical existence. The failure to reproduce renders all other achievements irrelevant. 

Prosperity, war, birth control, decadence, exploitation, austerity, abortion
and degradation reflected in the age structure of the German population 1910,
1970, 2009 and 2060
(HERE)
Take Germany for an example: The total population counts some 82 million, the current fertility rate is 1.43 and keeps declining. Out of the 82 million, some 17 million have a recent ‘immigrant background’, some 22 million are pensioners. Germany's impressive work force still counts some 40 million, while the neoliberal gulag of the Schroeder-Merkel regime produced an impoverished human junk heap of 11 to 18 million people. Eight million adults between 18 and 65 of age are unable to sustain themselves, are either jobless or working-poor, trapped in exploitive lease labor contracts, One-Euro-Jobs, part-times jobs, mini-jobs, and other odd Hartz-schemes. Half a million Germans are homeless, many of them children. Organized slavery entertained by the remaining tax payers. The average income laborer tributes two thirds of his gross income to a ruthless government that dished out 400 billion Euro to zombie-banks, and rips-off 100 million Euro every day to pay interest for the public debt. In this environment around 650,000 children are born each year (one third with 'immigrant background'), as compared to 840,000 yearly deaths, giving an annual shortfall of about 200,000. In other words, while over-aging and impoverishing dramatically, Germany loses the equivalent of a mid-sized city each and every year. In fact official German projections indicate that the total population will shrink to between 65 and 74 million by 2060, depending on annual net migration of 100,000 to 400,000. Obviously, the derailed reproduction of the natives (one out of three women never bears children; some 200,000 abortions every year; several hundred thousand homosexuals; etc.), along with genocidal immigration policies, population reduction and population replacement will essentially extinguish the historic German nation within this century. This general trend and time frame equally apply to almost all other European nations.

The all season disaster recipe from the Pentagon's cookbook:
NATO-engineered regime changes and civil wars, stimulated mass migration and
ensuing colonization of global venture lumpen-proletariat and refugees amongst
30 million jobless and 120 million poor native Europeans
(HERE + HERE + HERE)
Today the global average fertility rate is 2.3, and 80% of the world population lives in countries where women have on average fewer than 3 children. This means the global fertility rate is barely higher than the replacement fertility, and the increase of the world population is primarily due to the increasing length of life. In 1960 China’s fertility rate was 6.1. Now it has dropped to 1.6. In Iran, the fertility rate in 1985 was 6.3; now it is down to 1.9. In Thailand, the fertility rate was 6.14 in 1955, 3.92 in 1985, and is 1.49 today. The problem with the ‘developed world’ is not only that it is broke but that it is old and barren. Fertility rates are mostly way below replacement levels, many nations are over-aged and have reached the demographic point of no return. Globally the lowest fertility rates occur in the most modernized areas of Asia: China (1.55), Japan (1.40), South Korea (1.25), Taiwan (1.11), Hong Kong (1.04), Macau (0.91), and Singapore (0.80). Extinction level rates are also prevalent among Southern European countries and former Soviet states: Portugal (1.52), Spain (1.48), Italy (1.42), Greece (1.41), Poland (1.33), Ukraine (1.30), etc.

In Africa, children under age 15 account for 41% of the population in 2015 and young persons aged 15 to 24 for a further 19%. Latin America and the Caribbean and Asia, which have seen greater declines in fertility, have smaller percentages of children (26 and 24 %) and similar percentages of youth (17 and 16%). In total, these three regions are home to 1.7 billion children and 1.1 billion young persons in 2015.
 

Source: UN DESA


Source: CIA World Factbook


Source: CIA World Factbook

Monday, August 10, 2015

Bull and Bear Markets in Oil 1861-2015

Credit Suisse notes that bear markets in oil prices last between 11 and 28 years, while bull markets typically last less than 10.

Friday, August 7, 2015

The Real Price of Gold

A “golden constant” perspective suggests a fair value price for gold of $825 an ounce (HERE)

Campbell R. Harvey (Aug 3, 2015) - Using the U.S. Consumer Price Index as an arbitrary, though conventional, fundamental driver of the price of gold, the high real price of gold has been about 8.73, the low real price of gold has been about 1.47 and the current real price of gold is about 4.63.

[...] There are at least two ways to think about the current historically high real price of gold. One is that the real price of gold may “mean revert” towards the horizontal rust colored line, the golden constant value for gold linked with the average real price of gold. Or it is also possible that all of “history is more or less bunk”, as Henry Ford once put it, reflecting an idea that bold investors and innovators were never slaves to history.

Tuesday, August 4, 2015

The Strangeloves, the Crazies and the Butchers

While President Obama was in Ethiopia addressing the African Union on the problem posed by ISIS, the clique of warmongers around General John R. Allen and Recep Tayyip Erdoğan, President of Turkey, began its deceptive bombing attacks against the Kurds of northern Syria, weakening the most effective opponents of ISIS. The front page of The Washington Post declared the air campaign will be expanded into a “safe-zone” along the Turkish-Syrian border that “could become a haven for civilians” — meaning ISIS and Nusra butchers disguised as the “Free Syrian Army”. Pushing ISIS away from the Turkish border, regardless of the semantic argument over whether it will be a buffer zone/safe zone/no-fly zone or “civilian haven” are all methods for achieving the same end: Any place along the Turkish-Syrian border put under the control of the NATO-Turkey-Saudi-Qatar Axis represented by General Allen would act as a smuggling route transporting ISIS fighters, money and equipment into Syria and oil or other resources out of there. Thierry Meyssan of the Voltaire Network is providing new revelations about the role of Turkish President Erdoğan as one of the top terrorist controllers running ISIS and parallel groups like al Qaeda:

War Cycles on the rise (HERE)
“[...] in order to care for the wounded ISIS jihadis, Erdoğan has created a secret hospital, outside of the combat zones, in the Turkish town of Şanlıurfa, not far north of the Turkish-Syrian border. This town was already the site of a secret Al Qaeda training camp. The wounded ISIS fighters are taken to this hospital in Turkish military vehicles by the MIT (Milli Istihbarat Teskilati or national intelligence organization). This hospital is under the personal supervision of Sümeyye Erdoğan, the daughter of President Erdoğan. She is also the director of international relations for the Erdoğan-Davutoğlu AKP Islamist party. In addition, according to Gürsel Tekin, the spokesman of the Cumhuriyet Halk Partisi (Republican People’s Party), the crude oil stolen by ISIS is now being exported by BMZ Ltd., the shipping company controlled by Bilal Erdoğan, the son of President Erdoğan, in flagrant violation of Resolution 2170 of the United Nations Security Council. (HERE + HERE + HERE + HERE + HERE).

Sunday, August 2, 2015

Marvels of Creation - The Sun and the Lunar Cycle

This Persian manuscript made in 1566 is a translation of the famous cosmography Marvels of Creation, originally written in Arabic by the thirteenth-century Persian lawyer, physician, astronomer and geographer Zakariya ibn Muhammad al-Qazwini (1203-1283). The miniatures illustrate the lunar cycle and the path of the Sun’s rays interrupted by the globe of the Earth at the time of a lunar eclipse. Born in the Persian town of Qazwin, Zakariya served as legal expert and judge in several localities in Persia, traveled in Mesopotamia and Syria, and finally entered the circle patronized by the governor of Baghdad. He also wrote a futuristic proto-science fiction tale entitled “Awaj bin Anfaq” about a man who traveled to Earth from a distant planet. 


Credits: Nick Anthony Fiorenza
The Sun spews forth an endless stream of charged particles in all directions. This solar wind blows far out into the solar system and beyond. The Earth's magnetic field shields from direct contact with the solar wind's charged particles. The Earth's magnetic field is rounded towards the Sun, and stretches out in a long tail away from the Sun. The solar wind rushes around and past the Earth and on out into space while the Moon passes through the different sections of the Earths magnetic sphere in its monthly orbit. At New Moon it is always in the upstream portion of the magnetosphere, facing the Sun and downstream in the Earth's tail at Full Moon. At First Quarter, the Moon is to the dusk side of Earth and at Fourth Quarter, the Moon is in the dawn side of the magnetosphere. The 10th and 25th days of the lunar cycle are significant periods because these points are more or less in line with the 45 degrees vector along which solar corpuscular radiation reaches the Earth. At a phase angle of some 315 degrees the Moon effectively blocks and cuts off most of solar radiation during its cycle, while at the opposite point around 135 degrees, the Moon reaches a point of least blockage. When the Moon is less than 3.5 degrees from the plane of the ecliptic, geomagnetic activity reaches a minimum during the Second Quarter and a maximum during Third Quarter.

SPX vs Lunar True Node's Speed + Eclipse Crash Windows


Saturday, August 1, 2015

DJIA vs Lunar North Node in Zodiac Signs | Louise McWhirter

The mathematically calculated Lunar Nodes are sensitive points in space where the Moon’s orbit around the Earth
intersects the ecliptic - the Earth’s orbit around the Sun. The Ascending Node is where the Moon crosses from
south of the ecliptic to north of the ecliptic. The Descending Node is where it crosses from north of the ecliptic
to south of the ecliptic. In Western astrology the Ascending and Descending Nodes are known as the "North Node"
and the "South Node". Only the North Node is usually marked in horoscopes, as the South Node is by definition at
the opposite point in the chart. In Vedic astrology, the North and South Nodes are called Rahu and Ketu respectively,
and both are marked in the chart. Nodes always move retrograde and are considered natural malefics. Astrologically
the Nodes are thought to powerfully influencing both the affairs of nations and of people. Eclipses occur only near
the Lunar Nodes: Solar eclipses occur when the passage of the Moon through a Node coincides with the New Moon.
Lunar Eclipses occur when passage coincides with the Full Moon. The plane of the lunar orbit precesses in space
and hence the Lunar Nodes precess around the ecliptic, completing a revolution (called a Draconic or Nodal Period,
the period of nutation) in 6798.383 days or 18.612 years. The Nodes need 1.55 years to pass through one zodiac sign.

In her book 'Astrology and Stock Market Forecasting' published almost 80 years ago, financial astrologer Louise McWhirter described a theory of the business cycle. She claimed the low point of the depression was reached in summer of 1933 (Lunar North Node in Aquarius) and predicted the next peak in economic activity would occur in November 1942 (NN in Leo). Her prediction for recovery in 1942 coincided with the massive economic stimulus spending set in motion by the build-up for World War II. Looking at 100 years of stock market prices she consistently found the North Node in the sign of Aquarius during periods of low economic activity. At the halfway point in the 18.6-year cycle, the North Node is moving into the sign of Leo, where economic high points have historically been recorded. After this, the long-term trend moves lower as the North Node slowly and systematically makes its way back to the sign of Aquarius, where the cycle begins anew (see also HERE). 

Enlarge
Using McWhirter’s method, one would have expected the lowest economic period between January 2008 and August 2009 (NN in Aquarius), and then gradually improving from below normal levels to normal levels between August 2009 and August 2012 (NN in Capricorn, Sagittarius and Scorpio). The period between September 2012 and February 2014 was projected to be an above normal period for economic performance (unfortunately the red line of the averaged composite in the above chart doesn't clearly reflect this pattern). 

Though a considerable market correction between now and Q1 2016 is likely (HERE & HERE), a larger ensuing double-dip recession wouldn’t fit into the McWhirter-pattern (HERE). Instead the general upward trend should continue into the major peak-out between May 2017 and November 2018 (NN in Leo - HERE), followed by collapsing and declining markets into the 2020s (HERE).

Ranking of Countries by Sovereign Debt in Percent of GDP and Absolute Debt

Credits: countryeconomy.com

405 Year Sunspot Record Revised and Newly Calibrated

Credits: SILSO Data - Royal Observatory of Belgium, Brussels
Dating back to Galileo and the invention of the telescope, the 405-year solar sunspot record is the longest continuously monitored daily measurement in all of science. Studies into sunspots, solar and planetary cycles corresponding with trade cycles, crop prices and shifts in the markets have accelerated since the 19th century. Now, on July 1st, 2015 the official sunspot record underwent a complete overhaul for the first time since it was created by Swiss astronomer Rudolf Wolf in 1849. The newly calibrated record is likely to have implications in many diverse scientific disciplines including financial astrology.

Yet, this important change to one of science’s most fundamental measurements went literally unnoticed (HERE & HERE) Two sunspot record time series were recalibrated: The first is the traditional International Sunspot Number (ISN) record most people are familiar with. The second is the more physically meaningful group number. Groups have always been counted as part of the ISN. The newly released group number update redefines and corrects defects in the original 1998 version. The newly rebuilt group number time series shows that solar activity is considerably more ‘even’ over its 405-year history than previously thought. Formerly, it looked as though sunspot activity in the past was much weaker than at present, especially prior to 1890. Counting inconsistencies artificially created that non-existent effect. The rebuilt record contains four distinctive dips in solar activity that occur roughly every 100 years.