Thursday, June 6, 2024

The Five Stages of the Revolutionary Cycle | Martin Armstrong

Governments fall when the police no longer offer them protection. [...] The Revolutionary Cycle takes place in five stages:

Stage 1: Whistleblower Disagreements; Discontentment Grows
Stage 2: Initial Conflict Begins; Economy Begins to Decline
Stage 3: Civil Unrest Peaks
Stage 4: Revolution
Stage 5: Recovery

The FIRST STAGE in a revolution is always the rise of intellectual whistleblower disagreement, which the government simply ignores as a passing phase. This stage is the realization of corruption and injustice of governmental rule. Perhaps the symbolization of this was the revelation of Edward Snowden [2013 – present
] that the government was violating the constitution and abusing its power against the people, constructing a 100% surveillance state [...]

 » The former head of state is often publicly killed, and typically all their ministers. «

The SECOND STAGE is where the intellectual debates prove pointless, and the initial conflict begins. This corruption has run its course, and governments have transformed justice into their own self-interest. This stage is usually accelerated by governments raising taxes in the midst of an economic decline. [...] This is when history will typically produce some leader who can be a moderate who sees the problem and will often try to reason in order to reach a resolution that is ignored by the government. This further intensifies the feelings of injustice, especially in light of the economic decline. [...]

The THIRD STAGE is where it often becomes an outright war in the streets as governments seek to retain power and refuse to see the error of their ways. [...]


The FOURTH STAGE is retribution in a domestic revolution in direct confrontation with the government and head of state. [...] The former head of state is often publicly killed, and typically all their ministers.  [...]

 » Hang everyone. That's the only solution. «
Washington D.C. – May 31, 2024

The FIFTH STAGE is typically the recovery stage, where a new form of government emerges from the ashes. [...] During this recovery stage, the radicals are usually overthrown, and sometimes, a new head of state emerges, such as Napoleon or Oliver Cromwell. [...] Divisions emerge once again between opposing political views. At this point, there is the restoration of a sense of nationalism, but the cycle of corruption slowly begins to take root. 
 
We [the USA] are currently in the SECOND STAGE of the Revolutionary Cycle and rapidly heading toward STAGE THREE as discontent grows.
 
 
The end is nigh, draw or mate? – June 6, 2024
 
See also:

Wednesday, June 5, 2024

Nasdaq and S&P Top on June 12 | Barry Rosen

While Dow Transports and Industrials gave early topping signals and Russell has been struggling, NQ and the S&P have not given it up yet. We are still friendly stocks for about a week until S&P cash hits 5,400 and not in trouble unless S&P cash takes out 5,250 now. NASDAQ 100 June futures went and held key support at 18,240 on Friday. The S&P only managed a 3-wave fall although it did hit 5,193 —a bit deeper than we had liked. The astonishing close last Friday kind of thing funds love to see and so often 1st of the month buying comes in. 

S&P 500 (Daily Bars), Monthly Pivot Levels and 9-Day EMA.
 June 5 = Weekly Reversal Up.
 
 Nasdaq (Daily Bars), Monthly Pivot Levels and 9-Day EMA.
 June 5 = Weekly Reversal Up.

Cycles look positive the week of June 3rd and into the FOMC [Wednesday, June 12]. We had alerted you for secondary highs into the FOMC and they are starting to manifest. We are clear about a fall from June 12th into
June 20th and then will evaluate the pattern. Because the market only fell in 3 waves and NQ fell to the minimum support area, new highs on NQ to 19,200-19,300 are very likely. 
 
Quoted from:
 

Tuesday, June 4, 2024

The Sixth Wave and 2032.95 | Martin Armstrong

Here is the Economic Confidence Model at the very high end to all the questions about how high up the fractal structure can be defined.

 Martin Armstrong's Fractal Design of Time.

We are in the grand Public Wave overall that peaks in 2032.95. This is the equivalent of the wave that picked the Peak of Rome in 175 AD. So here, too, this is a wave where the government will fight very hard to hold control, for that is the dominant 309.6 character, while the final wave on the next fractal level is a Private Wave of 51.6 years. This is the people fighting back as they lose confidence in the government. The two forces are at war right now. The worse the environment becomes for the people, the more authoritarian governments will become. Each wave of 8.6 also alters back and forth between Public and Private.

This is why I warn it is time to try to reduce the amplitude by waking up. We achieved this briefly with the Age of Enlightenment. Government then fought back and reclaimed control. We replaced monarchy with ministers. Nothing changed otherwise. We will fight the good fight once again and seek to triumph with a new age of Enlightenment. Will we win? Who knows. But we have to try. What comes after 2032 is a private wave – the opportunity to reclaim our liberty once again.
Here is that chart.
 
 » It has been propaganda that we live under a democracy. The people have no right to vote on critical issues.  
Republics historically are the most corrupt forms of government. «

The last Sixth Wave marked the peak of the Roman Empire. Every historian has drawn the line to mark the beginning of the Fall of Rome took place with the death of Marcus Aurelius in 180 AD. Talk about almost getting to a new age, he sent an ambassador to China. This has been revealed by books from the Tang Dynasty. The East and West knew each other. Merchants ran the trade routes. This would have been the beginning of a major global economy back in 180 AD. Marcus’ death ended the golden age and expansion of the world economy. He was followed by his crazy son, Commodus. With the death of Commodus, the Praetorian Guard actually auctioned off the position of emperor to the highest bidder. Since he was just nuts, they got to rule Rome, and it went to the heads, to the point that corruption was in the open.
 

I have told the story of how I used to meet with people who wanted to run for President at the behest of those in the Republican Party. Then in 1999, I was asked to fly down to Texas to meet with George Bush, Jr. I was told that this was different. They had me meet with various potential candidates to vet them out and give my opinion if they could handle the job from understanding the global economy. So what was different with Bush, Jr., was the fact they told me he was “stupid.” I was shocked. I asked why would you want to make someone stupid president? I was told he had the “name.” That is when they asked me to be the chief economist in the White House. I declined, for our business was way too global for that. They told me the plan was to surround him with good people. That is how Cheney took the role of President and moved his office in the White House.

 » The 8.6 year frequency is fractal in nature and it may indeed 
work from different dates other than the formal dates we show on the ECM. «

I have been told similar traits with Obama. He was told they would let him play with the social stuff but leave everything else to them. The bureaucracy tasted power under Bush, and they were not about to let that go. Obama missed more than 60% of his daily security briefings. Biden is, at best, a part-time president who no one believes is truly running the nation because he simply is not mentally capable of doing so. This is the Praetorian Guard running the world.

 
» By no means try to use this for a individual market unless that market lines up with the ECM. «

The 18 Year Economic Cycle │Akhil Patel


Akhil Patel was the special guest presenter at the Foundation for the Study of Cycles' June 3 'Masters Working Group' interactive session. Author of 'The Secret Wealth Advantage', Patel discusses how the 18 year cycle affects the markets and how it can transform investing strategies. Patel is one of the world’s leading experts in economic, financial, and property cycles. He has been working for over a decade to produce unique research that combines an in- depth understanding of business, real estate, and stock market cycles. 


Saturday, June 1, 2024

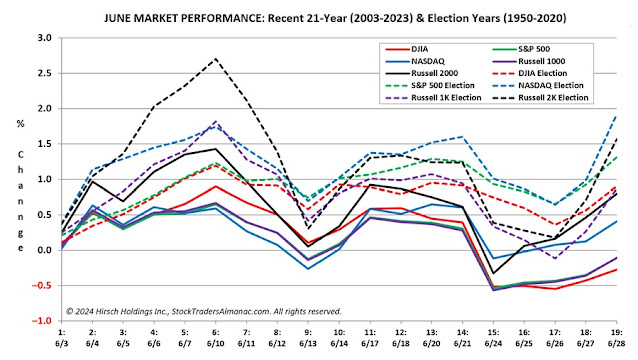
US-Stock Market Seasonality - June Better in Election Years │ Jeff Hirsch

Over the last twenty-one years, the month of June has been a rather lackluster month for the market.


DJIA, S&P 500 and Russell 1000 have all recorded average losses in the month. NASDAQ and Russell 2000 have fared better logging average gains of 0.4% and 0.8% respectively. Historically the month has opened respectably, advancing on the first and second trading days. From there the market then drifted sideways and lower near or into negative territory just ahead of mid-month. From there the market rallied to create a mid-month bump that quickly evaporated and returned to losses. The brisk, post, mid-month drop is typically followed by a month end rally led by technology and small caps.
 
In election years since 1950, June has followed a similar pattern to the recent 21-year period, but gains have been notably stronger, and all five indexes finish the month positive. Average June gains in election years range from 0.9% by DJIA to 1.9% by NASDAQ.


BofA - Historically, June-August is the 2nd best 3-month period for the S&P 500. 
In election years, it's the strongest.

BofA - It would not be surprising to see a bounce-back in the S&P 500 in early June, 
as historically, this period has demonstrated a trend of positive returns.

Goldman Sachs - Bullish mid-May through Labor Day. Choppy summer solstice to late July.
 
Solunar Rhythm in June 2024.
 
In Bull Markets, New Moons tend to be Bottoms, and Full Moons Tops. 
 In Bear Markets, New Moons tend to be Tops, and Full Moons Bottoms.
 

Friday, May 31, 2024

Broadening Formations & The Third Universal Truth | Robert F. Smith

The Third Universal Truth is this: There is only ONE price pattern. Everything trades in a continuous series of broadening formations because there are only three scenarios that can possibly play out from one bar to the next. Therefore only THREE types of bars exist: the Outside Bar, the Inside Bar, and the Directional Bar. It is impossible for price to do anything else. Range expansion on both sides occurs ONLY because Outside Bars exist. 

Broadening Formation on quarterly, monthly, weekly, and daily Apple Inc (AAPL) charts.
Inside Bar = 1 | Directional Bar = 2 | Outside Bar = 3

Almost every book on technical analysis claims that the broadening formation is extremely rare, when the truth is it is one of the only things that can possibly happen. A broadening formation is a pattern where ranges continue to expand on both sides, thus an outside bar is a broadening formation when you shorten the time frame of the chart. It must be because by definition the range is expanding on both sides. While many traders will talk about stocks making higher lows and lower highs, one thing is that securities will always trade in a series of higher highs and lower lows. Even if a stock is in a steady uptrend from, say, $80 to $100, somewhere along the way that stock will make a series of higher highs and lower lows on some time frame. 
 
 Basic Diagram of the Broadening Formation.

While this may seem irrational, it helps to analyze this statement from the perspective of supply and demand. When a stock reaches a new high, it means that a new group of buyers have been identified above the previous high. Eventually, that buying pressure exhausts, and the stock retreats. This new group of buyers becomes trapped, and this will create pressure to the downside, either on a short-term time frame or a long-term time frame. Inevitably, the stock will eventually get pushed towards a previous low, whether it's a recent low on a 15 minute chart or a major inflection point on a monthly chart. As the stock pushes towards this low, those buyers at highs will succumb to the selling pressure, drive the stock to a new low that is bought up by the sideline traders or natural buyers, and the stock will resume higher until it reaches the next new high. This series repeats itself, which creates a formation that can be fit into a triangle.
 
 Nasdaq (Daily Bars)
Inside Bar = 1 | Directional Bar = 2 | Outside Bar = 3
Every chart shows but Broadening Formations, nested series of Range Contractions and Range Expansions
on yearly, quarterly, monthly, weekly, daily and lower time frame charts. Full Time Frame Continuity occurs when all time frames point in the same direction, providing a more reliable assessment of the market's direction.

Nasdaq (4 Hour Bars)
Inside Bar = 1 | Directional Bar = 2 | Outside Bar = 3
 
Broadening Formations = ICT Seek & Destroy Profile
 
How to find a Broadening Formation?
  1. Identify an Outside Bar on a Higher Time Frame.
  2. Remember an Outside Bar takes out BOTH sides of the previous bar's range. This is how we gauge the potential magnitude of an expected move.
  3. An Outside Bar = A Broadening Formation on a Lower Time Frame chart. This is a FACT. Ignore previous Technical Analysis textbooks.
  4. Locate the High of the Outside Bar and DRAW BACK to a previous Higher High (HH Point #1 to #2). Generally try and use an extended line type drawing tool on your charting software as this will extend the line forward.
  5. Locate the Low of the Outside Bar and DRAW BACK to a previous Lower Low (LL Point #1 to #2).
  6. View the same chart on a Lower Time frame and watch the magic happen. Now you have a Broadening Formation.
  7. Note depending on your charting software you may have to adjust your lines at key high and low points when switching between different time frame charts this is normal and due to the difference in candlesticks between timeframes.
Reference:
 
 Robert Franklin 'Rob' Smith (1964-2023).
Life and death of a sporty American reborn Christian trader. R.I.P.
 
#TheStrat Setups with Entry, Stop and Target Levels. 
#TheStrat Risk/Reward Ratios are mostly sub-optimal.
ICT Optimal Trade Entry (OTE) strategies do improve poor #TheStrat RR-Ratios significantly.
 
28 #TheStrat Setups = 14 bullish + 14 bearish. 
 Inside Bar = 1 | Directional Bar = 2 | Outside Bar = 3

Wednesday, May 29, 2024

ICT Optimal Trade Entry (OTE) | Darya Filipenka

Timing is an important factor in trading, and a well-defined strategy can significantly increase your chances of success. The ICT Optimal Trade Entry (OTE) strategy is one approach that traders can utilize to identify high-probability trade setups. It’s important to pinpoint the specific time and day when the OTE is most likely to occur. Typically, this happens between 8:30 AM and 11:00 AM, New York local time.
 

Market Structure - As the market rises and declines and makes
higher highs/lower lows, each new swing higher/lower in price is anchored or directly reacting to another swing higher or lower. Every swing in price has an equal counter swing it is unfolding from and attempting to fulfill. 
 
Market Structure Shift (MSS) - comes from the HL or LH levels, it will serve as one of the reasons for us to enter the trade. A market structure shift is depicted as a significant level on the chart where the prior trend Is invalidated. When the market is in an uptrend, the market structure shift level is typically identified as a point where a lower low is formed. Conversely, in a downtrend, the market structure shift level Is often observed at a juncture where a higher high emerges. Notably, these market structure shifts tend to arise following a displacement, signaling a potential shift in the overall trend direction.

1. The Premium Zone represents the price correction range situated above the 0.5 (50%) level in the context of a downward momentum. Traders pay attention to this zone when considering selling opportunities.
2. The Discount Zone refers to the price correction range located below the 0.5 (50%) level in the case of an upward impulse. Traders observe this zone for potential buying opportunities.
3. The Equilibrium Zone denotes the price range where the asset's average price is located. In other words, it represents the fair price zone or the level of balance between buyers and sellers.
 

Traders and market makers seek opportunities to buy at a Discount and sell at the Premium zone. As a result, traders often disregard the 0.236 and 0.382 Fibonacci levels in their analysis and instead wait for the price to move above or below the equilibrium level. We focus on the Premium / Discount Zones, since the price does not always enter the OTE zone. Sometimes it is enough for price to adjust by 0.5 (50%) in order for the big man to gain or lose a position.
 

To select the high and low points of a dealing range, follow these steps:

1. Run a Fibonacci retracement tool from the highest high to the lowest low within the dealing range. This will help establish the overall range of price action.
2. Pay attention to areas where the algorithms consolidate. These consolidation areas indicate fair value and are important in determining the proper dealing range.
3. Consider the nearest high when the 50% Fibonacci level aligns with the common consolidation area. This will help identify the appropriate high point of the dealing range.
4. Select the lowest low as the low point of the dealing range. This ensures that the range encompasses the relevant price action and aligns with the areas where algorithms are active.

To implement the OTE strategy, follow these steps:

1. Determine the current market structure, whether it has a bullish or bearish bias. This ia crucial as Fibonacci levels work best within a trending market.
2. Identify significant swing highs and lows to draw the Fibonacci grid. These highs and lows are often visually prominent and easy to label.
3. Use the Fibonacci retracement tool to assess the correction potential in an uptrend (from bottom to top) or downtrend (from top to bottom).

Using OTE during Silver Bullet: After identifying the MSS, I recommend drawing an OTE retracement from the Swing Low (High) to the Swing High (Low). The optimal entry point for trades is typically at the 62% retracement level of that range. Once the trade is entered, the first target is typically set at the -27% extension level, and the second target is set at the -62% extension level. Wait for price to trade back into the FVG (Fair Value Gap) and then reprice out of the FVG towards the targeted pool of liquidity. Usually a FVG lines up with the 62% retracement level.  
 
Reference:

The Three-Bar High/Low System | Larry Williams

At one point in my career, I had over 30 consecutive winning trades using this next short-term trading strategy. You will first have to calculate a 3-bar moving average of the high and a 3-bar moving average of the lows. (Each bar represents the time period displayed on your chart. Use 5-minute charts for lots of signal, or 15-minute charts if you want a little less hectic trading career.) This is automatically done on all quote machines, although “in the old days” I did it by hand. You can have the old days!
  • You will first have to calculate a 3-bar moving average of the high and a 3-bar moving average of the lows.
  • The strategy is to buy at the price of the 3-bar moving average of the lows — if the trend is positive, according to the swing point trend identification technique — and take profits at the 3-bar moving average of the highs.
  • Sell signals are just the opposite. This means you will sell short at the 3-bar moving average of the highs and take profits at the 3-bar moving average of the lows. It is downright foolish to do this unless there is a reason to take only short sales. Our reason might well be that our swing point reversal system has told us the trend is down. Then, and only then, sell the high and cover at the lows.
Now let’s try to make some order out of all this.
 
 
Figure 9.5 shows the addition of the 3-bar mowing averages and the swing lines. I have marked the points where trend changes; we switch from buying the lows to shorting the highs following these reversals. The 3-bar high and low entry points are also shown. The game goes like this; trend reversal up so we buy the 3-bar low line and take profits at the 3-bar high and await a pullback to the 3-bar low. If the 3-bar low would create a trend reversal for selling, however, pass on the trade. Sells are just the opposite; await a trend reversal down, then sell all the 3-bar highs and take profits at the 3-bar lows.
 

Figure 9.6 has all the trend reversals marked off, so you can begin paper trading by looking for the buy and sell entries and exits. I suggest you walk through this chart to get a sense of how one can trade this very short-term approach. Note these are 15-minute bars, but the concept will work on 5-minute to 60-minute bars as well.

My “New Reversal Day” Discovery | Larry Williams

The most common reversal day is simply one where prices sell off substantially, almost always down limit, only to reverse and close up for the day. Such a day appears in the following diagram [A + B].

 
A series of top and bottom reversals are also shown for your observation. Notice, in each case, how a temporary reaction against the main trend was ended when we had the flush-out day with prices selling off drastically, then recovering, to close up for the day. A reversal day is even more significant the longer the correction has been in effect.
 
MY NEW REVERSAL DAY DISCOVERY

Our second form of reversal day, and one I’ll bet you’ve never even heard about, starts with prices heading sharply lower and closing, sharply lower prices might end up limit down, or just 
off sharply but, in any event, prices take a beating and are down handsomely for the day [C].

» When prices should go lower, but don't, buy ! «

The trend reversal is indicated the next morning when prices open a good deal higher than the previous day's close. Such unusual strength is indicative of a key reversal for the market. What happens, in essence, is that prices fail to follow through with the previous day's slide. This type of action is most unusual since lower prices forecast lower openings about 85% of the time. Lower prices, with substantially higher openings, are a sure thing that a new move has begun.

It is particularly significant if prices close down the limit, and the next day open slightly up. Limit moves should beget more limit moves. A reversal of this pattern points to a market opportunity.

A special point of interest here is that an extremely strong signal is generated any time you have two reversal days with the second one higher, for a buy, lower for a sale. This is an unusual display of strength. I cannot recall when such a signal did not produce profits.


 "New Reversal Days" in the NQ — April-May 2024 (daily bars)