Over the last twenty-one years, the month of June has been a rather lackluster month for the market.
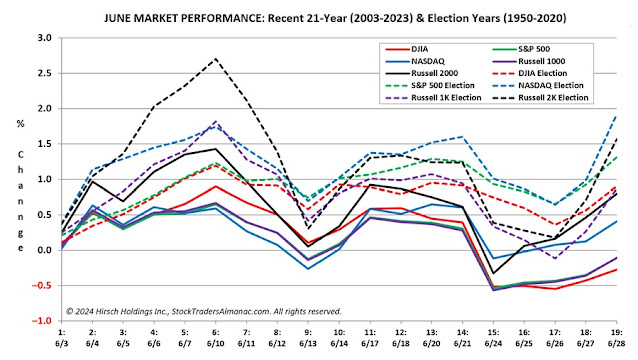

DJIA, S&P 500 and Russell 1000 have all recorded average losses in the month. NASDAQ and Russell 2000 have fared better logging average gains of 0.4% and 0.8% respectively. Historically the month has opened respectably, advancing on the first and second trading days. From there the market then drifted sideways and lower near or into negative territory just ahead of mid-month. From there the market rallied to create a mid-month bump that quickly evaporated and returned to losses. The brisk, post, mid-month drop is typically followed by a month end rally led by technology and small caps.
In election years since 1950, June has followed a similar pattern to the recent 21-year period, but gains have been notably stronger, and all five indexes finish the month positive. Average June gains in election years range from 0.9% by DJIA to 1.9% by NASDAQ.


In election years, it's the strongest.

BofA - It would not be surprising to see a bounce-back in the S&P 500 in early June,
as historically, this period has demonstrated a trend of positive returns.


In Bear Markets, New Moons tend to be Tops, and Full Moons Bottoms.