Showing posts with label Business Cycle. Show all posts

Monday, March 16, 2026

Louise McWhirter’s Forecasting Theory: The US Stock Market Through 2028

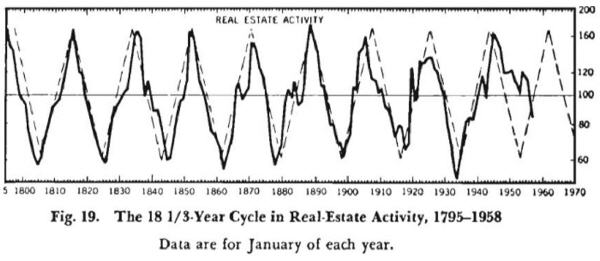
Louise McWhirter first presented her theory in her 1937 book "Astrology and Stock Market Forecasting." The model in the chart below demonstrates her claim that primary trends in business volume, finance, and stock prices are systematically delineated by the retrograde motion of the lunar North Node (NN) through the twelve signs of the zodiac. 

The draconic period of the true (osculating) lunar North Node is 18.612958 years (6,798.383 days). On average, 
each 30° zodiac sign is traversed in 566 days, or one year, six months, and nineteen days (1.55108 years).
 
The zodiac wheel is divided into four quadrants: "above normal," "normal," "below normal," and directional zones marked "prices up" (Leo through Libra) and "prices down" (Aquarius through Aries). Prominent arrows labeled "NODE TREND" and "TRANSITION PERIOD" indicate the clockwise retrograde flow, with gradual shifts occurring across defined transition zones near Scorpio–Sagittarius and Taurus–Gemini. Four pivotal turning points occur when the North Node enters the fixed signs, corresponding symbolically to the four heads of the cherubim in the Book of Ezekiel:
 
Aquarius represents the extreme low of business activity and the bottom of the cycle.
Leo signifies the extreme high of business activity and the top of the cycle.
Taurus marks the point at which business activity reaches a normal level while the overarching trend remains downward.
Scorpio indicates business activity reaching a normal level while the trend is upward.
 
The intervening signs provide precise transitional and amplifying effects:
 
► Aquarius: Extreme low of business activity, the bottom of the cycle.
► Pisces: Business activity approaches the bottom of the cycle.
► Aries: Business activity starts to fall below the normal level.
► Taurus: Business activity reaches a normal level, but the trend is going down.
► Gemini: Business continues to fall lower towards the normal level.
► Cancer: Business activity fades from the top.
► Leo: Extreme high of business activity, the top of the cycle.
► Virgo: Business activity goes even higher.
► Libra: Business activity starts to go above the normal level.
► Scorpio: Business activity reaches a normal level, and the trend is going up.
► Sagittarius: Business continues to go higher towards the normal level.
Capricorn: Business activity turns up from the bottom.
 
These phases are not instantaneous but unfold within the broader nodal transit and transition periods shown on the wheel. The following ingress dates, drawn directly from the established nodal cycle, demonstrate the theory’s practical application across recent and forthcoming years:
 
November 11, 2015: NN enters Libra. 
May 9, 2017: NN enters Virgo. 
November 6, 2018: NN enters Leo. 
May 5, 2020: NN enters Cancer. 
January 18, 2022: NN enters Gemini. 
July 17, 2023: NN enters Taurus. 
January 11, 2025: NN enters Aries.  
July 26, 2026: NN enters Pisces.
January 27, 2028: NN enters Aquarius
August 2, 2029: NN enters Capricorn. 
January 26, 2031: NN enters Sagittarius. 
October 2, 2032: NN enters Scorpio. 
April 2, 2034: NN enters Libra. 
October 25, 2035: NN enters Virgo. 
[The intervals reflect the variable motion of the true North Node, ranging from 542 to 623 days while averaging to the theoretical 566.532-day mean.] 
As of March 2026, the North Node resides in Aries, a phase in which business activity begins to fall below the normal level within the “prices down” quadrant. This downward pressure persists until July 26, 2026, when the Node enters Pisces. Throughout the remainder of 2026 and the entire year of 2027, the Pisces transit prevails, during which business activity steadily approaches the bottom of the cycle. The subsequent ingress into Aquarius on January 27, 2028 will mark the extreme low, completing the descent that commenced in Aries.
 
 
McWhirter’s model suggests subdued business volumes, contracting financial activity, and a prevailing downward bias in prices through 2027. While this part of her theory does not specify intra-sign turning points and acknowledges that secondary factors (such as other planetary cycles or policy interventions) may modify outcomes by up to 20%, it supplies a disciplined structural overlay that contextualises shorter-term technical, fundamental, and sentiment indicators. 
 
See also:

Wednesday, January 8, 2025

S&P 500 Post-Election Year Patterns by Political Party | Robert Miner

Since 1949, the typical pattern of a Post-Election Year is generally flat until late March. The second and fourth quarters are notably bullish, while the first and third quarters tend to be less so. A significant correction in the third quarter is usually followed by a bull trend into year-end. Since 1981, the average trend in Post-Election Years has followed a similar structure but with consistently higher returns (average performance of all Post-Election Years since 1949 +8%, since 1981 +15%).
 
Spring Low – Summer High – Fall Low – Bull into Year-End.
 Post-Election Years with 1st-Term Democrats +14%, 1st-Term Republicans +1%.

That said, Post-Election Year returns have historically favored 1st-Term Democrats. Since 1949, there has been only one instance of a loss during a Post-Election Year with a 1st-Term Democrat, while 4 out of 6 1st-Term Republicans saw losses.
 
 Market Action in Post-Election Years under Republicans and Democrats since 1953.
Jeffrey A. Hirsch, January 14, 2025.

Data suggests caution in the third quarter during a 1st-Term Republican administration, and the first quarter is typically the worst-performing. Swing traders should wait for the Spring Low to occur between late March and early April before entering long positions.
Post-Election Years generally show strong second-quarter performance with a consistent bull trend from the Spring Low to the Summer High (which can occur as early as mid-May), with an average return of around 4%. The Summer High period, from June to August, sees positive returns only in about one-third of Post-Election Years. 
 
The third quarter often trends sideways or down into the Fall Low in late September, with an average decline of around 7% from the Summer High. Since 1949, only one Fall Low to Year-End period has resulted in a loss, compared to an average gain of 7.6%. Since 1981, every Post-Election Year has seen positive gains from the Fall Low, making the Fall Low to Year-End rally the most consistent trend. Since 1981, each Post-Election Year has closed above the lows of September, October, and November, even if some years briefly dipped below. 

Friday, December 6, 2024

Due to 'Mega Forces': No More Bust, Only Boom | BlackRock Outlook 2025

In its 2025 Global Outlook, BlackRock states that the global economy has moved beyond the cycle of 'boom and bust,' driven by a fundamental shift fueled by the rise of "mega forces." BlackRock argues that the world economy is currently undergoing a transformation shaped by five new "mega forces:" (1.) the transition to net-zero carbon emissions, (2.) geopolitical fragmentation, (3.) demographic changes, (4.) the digitization of finance, and (5.) AI.

 Finally, a world forever rosy: No more bust, only boom.

BlackRock, which oversees $11.5 trillion in assets, believes that this "economic transformation" has broken the global economy free from "historical trends" that have seen markets cycle through boom and bust for centuries. "Mega forces are reshaping economies and their long-term trajectories—it's no longer about short-term fluctuations in activity leading to expansion or recession. [...] 2024 has reinforced our view that we are not in a business cycle: AI has been a major market driver, inflation fell without a growth slowdown, and typical recession signals failed." BlackRock anticipates that stocks will benefit from this ongoing global transformation, which will require massive investments from capital markets, potentially rivaling the investments seen during the Industrial Revolution of the 19th and 20th centuries.

If Schumpeter knew: Economy now free of cycles.
 
As a result, BlackRock suggests investors should rethink their strategies, focusing on long-term opportunities, such as capitalizing on the infrastructure needed for this emerging future. "We think investors should focus more on themes and less on broad asset classes as mega forces reshape whole economies. [...] Infrastructure is at the intersection of mega forces—like AI. The AI buildout is creating a huge and immediate need for data centers. Demand for new-build green infrastructure is skyrocketing as countries and tech companies race to reduce emissions."

In the short term, BlackRock expects US stocks to continue their rally in 2025, in line with trends showing US companies outpacing global competitors over the last decade. "We see the US still standing out versus other developed markets due to stronger growth and its ability to better capitalize on mega forces. We’re increasing our overweight position in US equities and expect the AI theme to broaden." A positive US economic growth outlook for 2025, combined with Donald Trump’s tax cuts and deregulatory initiatives, could further boost the prospects for US stocks.

Meanwhile, US-China tensions are expected to intensify competition for resources, such as "copper," as both nations vie for a competitive edge in AI. New import tariffs imposed by Trump could exacerbate the situation. BlackRock also points to aging global populations, which are likely to push up labor costs and keep inflation high, a trend that could be worsened by potential new limits on immigration introduced by Trump.

Thursday, March 21, 2024

The 500 Year Cycle | Raymond H. Wheeler

The 1000 year cycle tends to break down into halves of about 500 years each. Centering on the dates of 375 BC, 30 AD, 460 AD, 955 AD, and 1475 AD, climate was dry and colder than usual. The warm periods were short and were often disrupted by drops in temperature. Midway between these dates, the warm periods stretched out; the interruptions were not as long, and the cold periods shortened. The result is an intermediate cycle averaging 510 years in length.
 
 » Mass migrations were extensive, and all the ancient civilizations collapsed. «
Vandals sacking Rome, 455 AD.

The beginning of the first of these 500-year rhythms marks an important place in the history of climate. Prior to 575 BC, climatic cycles were longer and more extreme than they have been since then. In the two centuries immediately following, from 450 ta 320 BC, it was warm much of the time. Two 100-year cycles were almost fused into one. The cold period between them, at 420 BC, was very short. After that, the cold periods lengthened. By the end of this 500-year period, at the time of Christ, there was an exceptionally long cold period.

The cold phase centering on 460 AD, at the end of the next 500-year cycle, was also exceptionally cold. Mass migrations were extensive, and all the ancient civilizations collapsed. There was a long-term downward trend in rainfall. Although there were long cold phases in the 600s and 700s, they were frequently interrupted by silts to the warm side and did not seem to be exceptionally bad. The cold phases of the 800s and 900s were extremely severe, causing many migrations, primarily from the northern countries — especially when conditions began to deteriorate approaching 955, near the end of the 500-year rhythm.
 
 » Civilizations broke up and new ones took their places. «
 Migrants storming European Union borders, 2024 AD.

Subsequently, temperatures warmed suddenly. The 1000s were so warm that trees grew in Greenland. This was the period when Vikings crossed the Atlantic, One of the most severe hot droughts in history occurred in the 1130s. The 13th century saw a long warm period. Then climate began to deteriorate again. While the 14th century was warm much of the time, there were frequent and sharp drops in temperature; often it was very stormy. During several winters, the straits between Denmark and Sweden froze over solid enough to support horses and sleds, Greenland began to freeze. In the 15th century, there was no long warm period.

The next 500-year rhythm terminated at 1475. Subsequently, temperatures warmed up again. The 17th century was so warm that the next 100-year cycle had but a short cold phase, centering on 1655, and this was quickly interrupted by a shift back to the warm side. During the 19th and 20th centuries, climate deteriorated again.

 
» The 500 year period beginning at 1475 is drawing to a close. «
 Migrants breaching US southern border, 2024 AD.

Events of great importance occur every 500 years. Midway between 575 BC and 460 AD, the Roman Empire began its decline as Christianity rose. There were no strong European civilizations for a long time. On the other hand, there were very strong Asiatic empires such as that of the Huns. Midway between 460 and 1475, in the 9th and 10th centuries, a vast change occurred, again involving mass migrations, These events divided the Middle Ages into two halves. In the first half, there were brilliant empires like those of Justinian with its capital at Constantinople, Charlemagne in the West, and the Arabs in the East. The Arabs moved into Spain and India, developing brilliant civilizations at Cordoba and Bagdad. But all this came to an end. These civilizations broke up and new ones took their places. Following 975, the feudal period developed, with the growth of principalities that were to form modern European states. Amazing empires were built by the Mongols in Asia, the Incas in South America, and the Mayas in Central America. In India and Japan, new empires were born. The Balkans achieved their Golden Ages during this period.

All this came to an end in the 15th century. The Medieval economy, customs, and modes of thought disappeared. With the new 500-year climatic cycle came the Renaissance, the Reformation, and the building of modern nations — first under absolute monarchs, then under constitutional governments. This most recent 500-year cycle has witnessed the awakening of modern art, science, and economics. In these more advanced civilizations, the common people have, for the first time in history, come into their own under democratic political and economic systems.

 » The same types of events occur with almost clock-like regularity. «

The 500 year period beginning at 1475 is drawing to a close. We are now witnessing many of the same types of events that have occurred under similar circumstances with almost clock-like regularity five times before in history. These events are of the utmost significance for the businessman and student of today — and tomorrow.
 
Quoted from:
Raymond H. Wheeler (1943) - The 500 Year Cycle. 
With a Forecast of Trends Into the 21st Century.
 
  » A 500-year cycle is now terminating, which belonged to Europe.
The next 500-year cycle will belong to Asia. «
Raymond H. Wheeler, 1951.

See also:

Sunspots, Lunar Cycles and Weather Cycles | Louis M. Thompson

The occurrence of an 18- to 20-year cycle in weather in the U.S. Midwest is no longer controversial. The controversial issue is the cause. This article will present both sides of the issue, and will indicate why we will know more about the cause after the 1990s.


[...] The sunspot cycle has been associated with the “20-year drought cycle” in the western U.S. since about 1909, when A.E. Douglass started publishing his tree-ring studies. This scientist became so well known that he was able to establish the Laboratory for Tree Ring Research in Tuscon, Arizona, in 1938. 
 

[...] The sunspot cycle has averaged about 11 years since 1800. As the sun rotates on its axis, it makes a complete turn in about 27 days. Large and persistent spots appear to move from left to right for about two weeks, disappear, and return after about two weeks. The leading edges of spots or clusters of spots have a negative charge in one 11-year cycle and a positive charge in the next cycle. Hence, the term “double sunspot cycle.”


The conventional wisdom is that the drought cycle of about 20 years occurs near the end of the negative cycle and at the time of low solar activity. The drought periods of the 1910s, 1930s, 1950s, and 1970s occurred at the end of the negative cycle. The drought periods did not consistently follow that pattern from 1800 to 1900, although the severe droughts of the 1820s and 1840s occurred at the end of the negative cycle.

Quoted from:
Louis M. Thompson (1989) - Sunspots and Lunar Cycles: Their Possible Relation to Weather Cycles.
In: Cycles, September/October 1989, Foundation for the Study of Cycles.
 
See also:
William Stanley Jevons (1875) - Sunspots and the Price of Corn and Wheat.

The 18.6 Year Cycle in the General Economy | Louis M. Thompson

I believe there are weather cycles that trigger events in our economy, and I believe there is one weather cycle that is related to the 18.6 year lunar cycle. For that reason, I have prepared a lunar declination chart patterned after Fig. 1 and shown as Fig. 3. If a relationship between the lunar cycle and the weather cycle can be explained, we will gain a real milestone in explaining the business cycle.


[...] We have a 9.3-year cycle in production, which gives rise to a 9.3-year cycle in grain prices. Highest yields have occurred at the time of minimum declination and the four following years. Lowest prices have occurred because of a build-up of supplies, and the low prices have occurred about every 9.3 years and every 18.6 years. Fig. 3 describes the cycle in agriculture better than it does the general economy. Yet, as we look back to the nineteenth century, there were depressions at the time of maximum declination (285°) in every 18.6-year cycle. In this century, our lowest agricultural prices occurred in 1913, 1932, 1950, 1969, and 1987, or every 18.6 years. lt appears that a weather cycle of 18.6 years drives a production cycle of the same length, which drives a price cycle of the same length.

Quoted from:
Louis M. Thompson (1989) - The 18.6-Year Cycle in the General Economy.
In: Cycles, May/June 1989, Foundation for the Study of Cycles.
 
See also:
In: Cycles: The Science of Prediction.

Friday, October 21, 2022

Global Real Estate Bubble Index 2022 | 18.6 Year Real Estate Cycle

UBS (Oct 11, 2022) - Nominal house price growth in the cities analyzed accelerated to 10% from mid-2021 to mid-2022, representing the highest increase since 2007. Four US cities — Miami, Los Angeles, San Francisco, and Boston — are among the top five with the fastest-growing prices.
 

Imbalances
are sky-high in both analyzed Canadian cities, with Toronto topping the index. Valuations in Frankfurt, Zurich, Munich, and Amsterdam also show elevated risks in Europe. In contrast, there is no bubble risk in the US cities. Since last year, mortgage rates have almost doubled on average across the cities analyzed. Alongside increased prices, this makes city housing much less affordable. A skilled service sector worker can afford roughly one-third less housing space than before the pandemic. 
 
 
In almost all cities, households have been leveraging up. Outstanding mortgages recorded the strongest increase since 2008. Debt-to-GDP is on the rise as well, reflecting the cheap financing conditions and weak economic growth since the pandemic. People have returned to the cities. Strong household formation and unaffordable owner-occupied housing drove demand for rental units. As a result, rents grew by 7% on average last year, making up all rental losses accumulated during the first year of pandemic. Higher interest rates, inflation, turmoil in the financial markets, and deteriorating economic conditions are putting the housing boom under pressure. In a majority of cities with high valuations, price corrections have either already begun, or are expected to start in the coming quarters [...] 

Edward R. Dewey & Edwin F. Dakin, 1947:
"No matter what index be used, this 18-year cycle rhythm seems one of the clearest,
most regular patterns revealed in our economic life.
"
 
In 1947 Edward R. Dewey and Edwin F. Dakin showed that 18.6 year real estate cycles have repeated over centuries: in times of inflation or deflation, whether interest rates are high or low, with or without trade barriers, with government subsidies, and with high, low or no taxes. Fred Harrison demonstrated considerable economic predictive power relating to this 18.6 year cycle pattern: 14 years up, interrupted by a mid-cycle dip, followed by 4 years down. In over two centuries, this cycle has only ever been disrupted by two world wars. The cycle has never been shorter than 17 years, or longer than 21.

Dewey and Dakin wrote: "The building cycle is so long that few people experience two complete cycles in their business life. Education, to be effective, must therefore be “book knowledge” rather than experience […] For many individuals, an unfavorable first experience means a lifetime tragedy […] The welfare of an individual is often determined by the time in which he was born. If he is old enough to start business at the low of a business cycle, which is accompanied by […] rising prices, his chances for success are very good. Conversely, if he is born at such a date that he starts in business at the peak of a building cycle, which is accompanied by falling commodity prices, his chances of success are small. Much of the success or failure of an individual is due to forces over which he has no control; but if he understands these forces, he may protect himself from the worst results of unfavorable combinations and profit personally from favorable combinations."
 
All cycles have the same characteristics, but different influences, and government intervention in markets cannot create or suppress the real estate cycles. Credit, created by banks, through fractional reserve banking, fuels the cycle. Each recession brings new rules and regulations to the banking industry, designed to stop problems and prevent abuses; each upturn brings new ways to profit by exploiting loopholes in those rules and regulations. 
 
Residential real estate is first to recover from a downturn. The mid-cycle slowdown is confusing: The 18-year cycle is so long that few people remember the last one, and when market expansion quickly resumes, people think everything is fine. But the coming downturn will always be much worse than a mid-cycle slowdown. In the final years of a cycle, authorities congratulate themselves on how well they are managing things. If banks know the government will bail them out, why be prudent in lending. Seeing huge returns of others, the masses rush into real estate investing, believing it never goes down until fear overtakes greed. Land values peak about 12-24 months before a recession. 
 
A peak in the building cycle usually follows peak in land values, but precedes the recession. Announcement of the next ‘world’s tallest building’ may well be the most reliable indicator of an approaching peak. Copper prices spike into the last years of each real estate cycle. In the US all recessions since 1960 have been preceded by an inverted yield curve. The turning point in a cycle is often the collapse, or near collapse, of a major bank; some event will arise to cause doubt, but you’ll hear assurances that everything is okay. 
 
The crisis at the end always comes in an environment of rising interest rates, and the stock market is first to trough because of its far greater liquidity. Investors, speculators, and homeowners with little equity at the end of a cycle will always be wiped out. Always. Recovery takes years, not months. Historically, prices have dropped 20-30% from previous peaks. In the US the 18.6 Year Real Estate Cycle is expected to peak and crash again around 2025 - 2026.
 
 
See also:

Saturday, February 18, 2017

Sunspots and the Price of Corn and Wheat | William Stanley Jevons

William Stanley Jevons (1835–1882)
William Stanley Jevons (1835–1882) was a British economist and philosopher who foreshadowed several developments of the 20th century. He is one of the main contributors to the ‘marginal revolution’, which revolutionized economic theory and shifted classical to neoclassical economics. He was the first economist to construct index numbers, and he had a tremendous influence on the development of empirical methods and the use of statistics and econometrics in the social sciences. Jevons also analyzed business cycles, proposing that crises in the economy might not be random events, but might be based on discernible prior causes. To clarify the concept, he presented a statistical study relating business cycles with sunspots.

Daniel Kuester & Charles R. Britton (2000) - William Stanley Jevons summarized his thoughts on the effects of weather on economic activity in three chapters of his book "Investigations in Currency and Finance" (1909). An in-depth examination of these essays reveals some very interesting conclusions. In the first essay entitled “The Solar Period and the Price of Corn” (1875) he first investigates the striking similarity between the length of many historical business cycles and the length of the average length of the sunspot cycle. 
 
Jevons finds that the prices of most agricultural products vary dramatically over an eleven year cycle. He cites English agricultural price data from the years 1259-1400. The prices of wheat, barley, oats, beans, peas, and rye reach a relative minimum in the second year of the cycle, an absolute maximum in the fourth year of the cycle and an absolute minimum in the tenth year of the cycle before recovering in the final year of the cycle and the first year of the new cycle. There does appear to be a rather obvious and consistent trend in prices over these eleven year periods. Jevons discovers that the data (English wheat prices from 1595-1761) available to him in the Adam Smith’s The Wealth of Nations (1776) confirm similar although less marked trends in agricultural prices.

 
Jevons does not discount other significant factors that might cause the rather predictable nature of these business cycles. Technological advancements, wars, and other factors independent of agricultural and weather cycles can and do exhibit great influence over the economic well being of a nation. Also consumer confidence or a lack thereof could cause significant variations in spending and employment. However, Jevons believes that these consumer attitudes may also be related to the sunspot theory and the corresponding droughts and bumper crops which may result. “If, then the English money market is naturally fitted to swing or roll in periods of ten or eleven years, comparatively slight variations in the goodness of harvests repeated at like intervals would suffice to produce those alterations of depression, activity, excitement and collapse which undoubtedly recur in well- marked succession.” Jevons believes that if it were possible to accurately predict the sunspot cycle and the corresponding bumper crops and droughts then it would also be possible to predict impending economic crises.

In the second essay “The Periodicity of Commercial Crisis and Its Physical Explanation” (1878) with “Postscript” (1882) W.S. Jevons continues his study. In this essay he attempts to find empirical evidence to support his claim that business cycles follow predictable patterns which can be tied to the length of the sunspot cycles. Jevons claims that the relationship between weather patterns and business activity display a stronger relationship in primarily agrarian societies such as India and Africa. This claim makes this subject more meaningful in studying the relationship between weather patterns and economic activity in arid and semi- arid lands.

 
One piece of empirical evidence which W.S. Jevons believed would strengthen his sunspot business cycle theory actually has weakened this theory somewhat in retrospect. “There is more or less evidence that trade reached a maximum of activity in or about the years 1701, 1711, 1721, 1732, 1742, 1753, 1763, 1772, 1783, 1793, 1805, 1815, 1825, 1837, 1847, 1857, 1866. These years marked by the bursting of a commercial panic or not, are as nearly as I can judge, corresponding years, and the intervals, vary only form nine to twelve years. 
 
There being in all an interval of one hundred and sixty five years, broken into sixteen periods, the average length of the period is about 10.3 years.” Jevons points out that it is reasonable for the business cycles to vary somewhat in duration as it is reasonable to expect that there will be different lags between droughts and economic downturns based on inventories available and on the variations in trade patterns and ability to obtain imports quickly.

Potentially the most troubling conclusion that Jevons reached was that a sunspot cycle and the corresponding changes in agricultural yield and national productivity would follow a predictable pattern of approximately 10.3 years. Most astronomers now believe that the sunspot cycle does indeed last approximately 11.11 years which is somewhat troubling and is something that Jevons’ son attempts to address. 
 
This potential difference in sunspot duration is a primary reason this subject has not been studied as much as might be expected. However the findings of García-Mata and Shaffner provide some credence to Jevons’ theory. “Summing up, we can say that from a statistical point of view there appears to be a clear correlation between the major cycles of non-agricultural business activity in the United States and the solar cycle of 11+ years.” These authors also claim that it is reasonable that there could be some variation in the duration between sunspot cycles and that there is evidence that these cycles do correspond with business activity.

Christopher Scheiner's 1626 representation of the changes in sunspots over time (1630, recordings from 1611). Scheiner, a Jesuit astronomer, eventually published the definitive work of the 17th century on sunspots, in which he accepted Galileo’s argument that sunspots "move like ships" on the surface of the Sun. Scheiner and Galileo agreed that sunspots counted against the Aristotelian doctrine of celestial incorruptibility. Earlier Jesuits had been open on this point. Clavius argued for the corruptibility of the heavens after the nova of 1572. Scheiner here publicized the fact that the Jesuit theologian Robert Bellarmine had argued for the igneous nature of the stars and the corruptibility of the heavens even before 1572 on the basis of biblical exegesis and the tradition of the Church Fathers. Cardinal Orsini paid for the printing of this lavish work (Rosa Ursina - The Rose of Orsini, 1630).
The third essay on sunspots and the business cycle was entitled “Commercial Crisis and Sun-Spots Part I” (1878) and “Part II” (1879) completed W. S. Jevons thoughts on the relationship of weather and business activity. In this essay he continues to discuss the existence of a solar cycle of 10.45 years as being wholly consistent with his findings and being a better predictor of economic variables than the now widely used duration of 11.11 years.
 
Despite this potentially unfortunate conclusion Jevons elaborates on the potential relationship between solar and weather cycles and economic activity. He concludes that solar patterns should be studied to determine if a causal relationship does indeed exist between solar patterns and economic activity. If so, then policies should be enacted to reduce the magnitude of the contraction/recession parts of the business cycle. 
 
Jevons further elaborates on the importance of the solar cycle on consumer confidence and spending. “From that sun which is truly ‘of this great world both eye and soul’ we derive our strength and our weakness, our success and our failure, our elation in commercial mania, and our despondency and ruin in commercial collapse.” Jevons also finds more empirical evidence that corn prices in Delhi reach maximum and minimum in a similar eleven year pattern which has been exhibited in Europe. Once more this theory seems much more applicably to arid and semi-arid regions such as India.

 Sunspot illustration from Scheiner's Rosa Ursina, 1630.
 
William Stanley Jevons’ son H. Stanley Jevons continued his work on sunspots and published “Changes at the Sun’s Heat as the Cause of Fluctuations of the Activity of Trade and of Unemployment” in Contemporary Review in 1909. He reissued it in a monograph entitled The Sun’s Heat and Trade Activity (1910) in which he further examined and elaborated on the subject. H. S. Jevons believed that his father had some excellent ideas in relating the sunspot theory to the length of business cycles although he does acknowledge some of the criticisms which have been leveled at the work W.S. Jevons did. He states that the sun’s activity has some effect on economic outcomes and while it is not the only variable which should be considered when formulating economic policy it is worth considering when formulating economic policy.

H.S. Jevons acknowledges that his father was in error when he claimed that he solar cycle would only last approximately 10.45 years. He claims that W.S. Jevons attempted to oversimplify his findings and he ignored some events which created economic booms and busts which had nothing to do with arid land’s agricultural productivity. This is what led him to the false 10.45 year business cycle predictor. However he found that wheat production in the United States displayed significant variation during the nineteenth century and reached its peak approximately every 11.11 years. 
 
He found a direct relationship between solar activity and wheat production in the United States. H.S. Jevons believes that the eleven year sunspot cycle is actually a combination of three shorter sunspot cycles which were just over three years in duration. There would be a period of drought approximately every 3.5 years and a period of cold damp weather approximately every 3.5 years. This great harvest would precipitate a trade boom according to Jevons. He finds data that suggest the production of pig iron and agricultural produce in the United States were closely related and followed the sunspot cycle closely. He also states that on occasion the business cycle will only correspond with two of these shorter sunspot cycles explaining the variation in business cycles between seven and eleven years. This can explain the error that W.S. Jevons did not understand about the variation in the length of business cycles. H.S. Jevons provides several suggestions as to how this information about solar activity can be useful. He believes that if output and therefore trade can be expected to decline in the near future that there should be wage cuts to attempt to ensure full employment. 
 
This suggestion is not reasonable today but if we are going to engage in interventionary fiscal and monetary policy the potential to predict shortfalls in productivity and potentially consumer confidence can have meaningful implications for expansionary monetary policies being enacted. This is particularly useful if there are actual psychological ties between solar activity and consumer’s attitudes which sounds far fetched but may occur. Jevons also recommends less domestic reliance on crops would reduce the variation in economic prosperity. While crop production is still important in many arid and semi-arid lands, this is not as meaningful to the economy as it was when Jevons wrote.