UBS (
Oct 11, 2022) - Nominal house
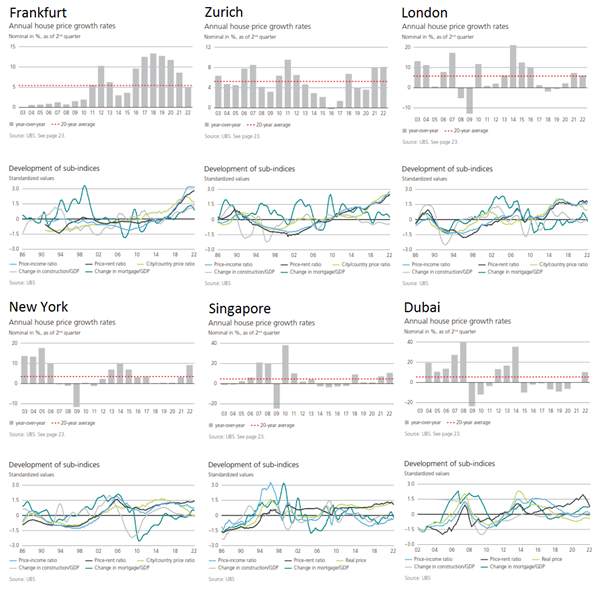
price growth in the cities analyzed accelerated to 10% from mid-2021 to mid-2022, representing the highest increase since 2007. Four US cities — Miami, Los Angeles, San Francisco, and Boston — are among the top five with the fastest-growing prices.
Imbalances are sky-high in both analyzed Canadian cities, with Toronto topping the index. Valuations in Frankfurt, Zurich, Munich, and Amsterdam also show elevated risks in Europe. In contrast, there is
no bubble risk in the
US cities. Since last year,
mortgage rates have almost doubled on average across the cities analyzed. Alongside increased prices, this makes city housing much less affordable. A skilled service sector worker can afford roughly one-third less housing space than before the pandemic.
In almost all cities, households have been leveraging up. Outstanding mortgages recorded the strongest increase since 2008. Debt-to-GDP is on the rise as well, reflecting the cheap financing conditions and weak economic growth since the pandemic. People have returned to the cities. Strong household formation and unaffordable owner-occupied housing drove demand for rental units. As a result, rents grew by 7% on average last year, making up all rental losses accumulated during the first year of pandemic. Higher interest rates, inflation, turmoil in the financial markets, and deteriorating economic conditions are putting the housing boom under pressure. In a majority of cities with high valuations, price corrections have either already begun, or are expected to start in the coming quarters [...]
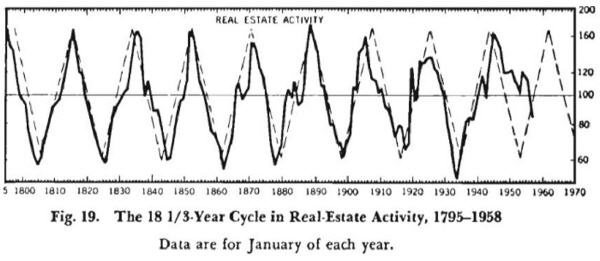 |
Edward R. Dewey & Edwin F. Dakin, 1947:
"No matter what index be used, this 18-year cycle rhythm seems one of the clearest,
most regular patterns revealed in our economic life." |
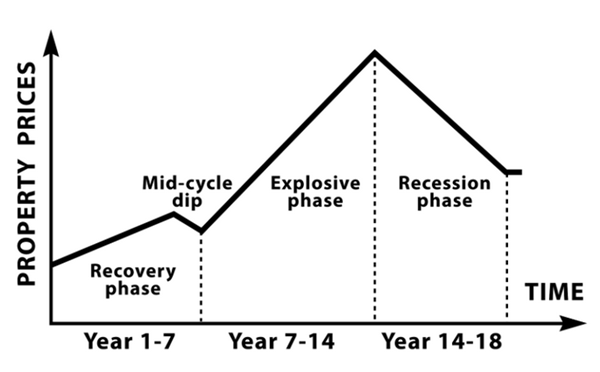
In 1947 Edward R. Dewey and Edwin F. Dakin showed that 18.6 year real estate cycles have repeated over centuries: in times of inflation or deflation, whether interest rates are high or low, with or without trade barriers, with government subsidies, and with high, low or no taxes. Fred Harrison demonstrated considerable economic predictive power relating to this 18.6 year cycle pattern: 14 years up, interrupted by a mid-cycle dip, followed by 4 years down. In over two centuries, this cycle has only ever been disrupted by two world wars. The cycle has never been shorter than 17 years, or longer than 21.
Dewey and Dakin wrote: "The building cycle is so long that few people experience two complete cycles in their business life. Education, to be effective, must therefore be “book knowledge” rather than experience […] For many individuals, an unfavorable first experience means a lifetime tragedy […] The welfare of an individual is often determined by the time in which he was born. If he is old enough to start business at the low of a business cycle, which is accompanied by […] rising prices, his chances for success are very good. Conversely, if he is born at such a date that he starts in business at the peak of a building cycle, which is accompanied by falling commodity prices, his chances of success are small. Much of the success or failure of an individual is due to forces over which he has no control; but if he understands these forces, he may protect himself from the worst results of unfavorable combinations and profit personally from favorable combinations."
All cycles have the same characteristics, but different influences, and government intervention in markets cannot create or suppress the real estate cycles. Credit, created by banks, through fractional reserve banking, fuels the cycle. Each recession brings new rules and regulations to the banking industry, designed to stop problems and prevent abuses; each upturn brings new ways to profit by exploiting loopholes in those rules and regulations.
Residential real estate is first to recover from a downturn. The mid-cycle slowdown is confusing: The 18-year cycle is so long that few people remember the last one, and when market expansion quickly resumes, people think everything is fine. But the coming downturn will always be much worse than a mid-cycle slowdown. In the final years of a cycle, authorities congratulate themselves on how well they are managing things. If banks know the government will bail them out, why be prudent in lending. Seeing huge returns of others, the masses rush into real estate investing, believing it never goes down until fear overtakes greed. Land values peak about 12-24 months before a recession.
A peak in the building cycle usually follows peak in land values, but precedes the recession. Announcement of the next ‘world’s tallest building’ may well be the most reliable indicator of an approaching peak. Copper prices spike into the last years of each real estate cycle. In the US all recessions since 1960 have been preceded by an inverted yield curve. The turning point in a cycle is often the collapse, or near collapse, of a major bank; some event will arise to cause doubt, but you’ll hear assurances that everything is okay.
The crisis at the end always comes in an environment of rising interest rates, and the stock market is first to trough because of its far greater liquidity. Investors, speculators, and homeowners with little equity at the end of a cycle will always be wiped out. Always. Recovery takes years, not months. Historically, prices have dropped 20-30% from previous peaks. In the US the 18.6 Year Real Estate Cycle is expected to peak and crash again around 2025 - 2026.
See also: