Showing posts with label W.D. Gann's Financial Time Table. Show all posts

Sunday, September 8, 2024

Kitchin Cycle Suggests DJIA Decline Until End of 2025 | Sergey Tarassov

 » DJIA correction begun, and the 41 Month Kitchin Cycle suggests a decline until the end of 2025. «  
 —  Sergey Tarassov, August 5, 2024.
 
» Multiyear High in the DJIA between June and October 2024, i.e. sometime
between the crests of the 40 Month Cycle and the 42 Month Cycle.
  «    
 —  Sergey Tarassov, June 25, 2024.

Reference:
Sergey Tarassov (August 5, 2024) - Tune Up 41 Month Kitchin Cycle for DJIA. (video)
Sergey Tarassov (June 25, 2024) - Review of Forecasts for DJIA, Gold, Bitcoin, IOC and Mexican Peso. (video)

 2024 in W.D. Gann's Financial Time Table: » Major Panic - CRASH! «
 
—  Martin Armstrong, June 14, 2024.
 

Tuesday, July 16, 2024

Prophecy of Trump Assassination Attempt & Market Crash | Brandon Biggs

» I saw an attempt on Trump's life. This bullet flew by his ear and it came so close to his head that it busted his ear drum. And I saw he fell to his knees and he started worshiping the Lord. He got radically born again. He became really on fire with Jesus.  « 
 
  
» I saw a great economy crash - worse than the Great Depression. « 
 
» And then I saw Trump winning the presidency through the patriots coming out voting for him. And then there will be a great economy crash - worse than the Great Depression. And the Lord warned me about this would be a great dark time. And then I could see that darkness and heaviness upon America. And I saw Donald Trump praying in the Oval Office. He was weeping before the Lord with his hands on his head. Then the crisis started to lift and good times coming back again. But the Lord said it would be a season of a shaking. « 
 
Brandon Biggs, March 14, 2024.


Meanwhile in Uganda.

Friday, March 15, 2024

S&P 500 Index vs 18.61 Year Lunar Node Cycle │ March - April 2024

 
» I’m not trying to predict the future; I am trying to accurately and quickly depict the present. 
I’m not trying to predict what people will do, but rather identify what they are doing right now. «  
Chris Camillo, 2023
 

Monday, January 8, 2024

S&P 500 Index vs 18.61 Year Lunar Node Cycle │ January 2024


» The lunar node, quite abstractly speaking, is the point of intersection of the solar and the lunar orbits. There are, therefore, two nodes in opposite positions in the heavens: an ascending node or lunar north node, and a descending node - the lunar south node. The solar and the lunar orbits are not, in effect, in the same but in different planes, enclosing a certain angle. Thus there arise the two opposite points of intersection. The peculiarity of these two points of intersection is that they do not stand still but slowly move. The plane of the lunar path rotates in relation to the plane of the solar path; so the two nodes move a round. They move around the Zodiac in a contrary direction to the rotation of the planets, i.e., from Aries backward through Pisces, Aquarius, etc. A complete revolution of a lunar node takes place in 18 years and 7 months; after this time, therefore, the node — the ascending node, for example — is once again in the same position in the Zodiac as it was before. The ascending node is, thereby, the mathematical point that (at any given time and again after 18 years and 7 months [= 6,798.383 CD] the lunar orbit rises above the solar orbit, while at the opposite point the descending node sinks below it. «

Willi O. Sucher, 1937.
 

Thursday, December 21, 2023

S&P 500 Index vs 18.61 Year Lunar Node Cycle │ Projection into April 2024

 
Dec 21, 2023 (Thu) = May 10, 2005 (Tue)
 
 
 In bull markets, New Moons are bottoms, and Full Moons are tops. 

Jan 3 (Wed) 22:30 = 270°
= Last Quarter    
Jan 11 (Thu) 06:57 = 0° = New Moon    
Jan 17 (Wed) 22:52 = 90° = First Quarter    
Jan 25 (Thu) 12:53 = 180° = Full Moon    

Tuesday, June 20, 2023

L.H. Weston - Gann’s Professor | Hans Hannula

I've been told that Gann was very private about his office. He absolutely forbid anyone from entering it. He wanted to protect his secrets. But one document he kept in his safe. That document was a manuscript by Professor Weston of Washington, D. C. It was written in 1921 (part 1) and 1923 (part 2), four to six years before Gann published his Tunnel Thru the Air, Or Looking Back From 1940, Tunnel Thru the Air contains, in coded form, Gann’s explanation of how to use planetary cycles to trade stocks and commodities. 
 

He told his own family that it was all they ever needed to learn his market secrets. Many Gann students have labored very long and hard (yes, me, too) to decode Gann's writing. Gann loved to write in the abstract style of the Biblical mystics, whom he admired. Much of what is written in the Bible is information about planetary cycles. It is hidden in census counts, symbolic imagery, and heavily coded to escape notice of the casual reader. While one can dig out this material, it takes time, an ephemeris, and a lot of work. Gann had it much easier. What you are about to read is the paper Gann kept in his safe. 
 
Take your time and read it carefully. It’s one of the best papers ever written on the market. 
After you read it, I'll point out some interesting things about it.
 
 
[...] First, this is clearly the foundation of Gann’s use of the 10 year cycle, and its multiples. Second, this is historically a fairly early use of Fourier sequences, and far more mathematical than just using financial astrology. This is no surprise, since it is well known that Gann was a very good mathematician. It is also a source of many of his ideas that market movements follow geometric rules.
 

[...] It is also quite interesting that Weston actually proposed two different versions of the ten year pattern. The first is his computation, using 50 years of data, of a series composed of 20 , 28, 10, and 14 month components, to which he adds a Venus term. In this system he cites use of heliocentric positions. We'll call this first method "Weston’s Curve’.

A most interesting point made in this method is Weston’s discovery that the planetary cycles tend to slip to synchronize with the earth’s annual cycle. I discovered this in my own work, and was sure it was an original discovery. So much for that vanity!

The second method I call “Weston’s Snowflake.” In it he proposes a sequence of turning points in the Jupiter-Saturn cycle that divides it into 10 irregular parts. Interestingly, Weston claims that this is a geocentric system. We'll show in a moment that it was not. But this “false lead” may have been intended for those whom Weston feared would learn his secret. Gann obviously made good use of Weston’s methods.  


[... Weston used] the 0, 18, 54, 90, 126, and 180 degree points of the Jupiter-Saturn cycle as turns. One can quickly see the problem with using this geocentrically. Almost all of the points are triple points, as the earth moves around the sun, giving multiple views from which to measure the angle between Jupiter and Saturn. The problem becomes one of which points to use.

[...] It took only one look at using this rule heliocentrically to convince me that Weston used it that way. Obviously, W. D. Gann watched these outer configurations to be alert for the deviations they might cause in the Jupiter-Saturn cycle. You are advised to do the same.

Monday, August 27, 2018

S&P 500 Index vs 18.61 Year Nodal Cycle | Aug 27, 2018 = Jan 14, 2000

Jan 14, 2000 (Fri = Major High in DJIA) + 6,800 CD = Aug 27, 2018 (Mon)

A high should print around Aug 30 (Thu) ± 1 CD.
Aug 30 will be also
195 Solar Degrees of geocentric longitude from the Major Low on Feb 09 (Fri)
and 1,440 Lunar Degrees from the Low on May 03 (Thu).

Saturday, March 3, 2018

S&P 500 Index vs Astronomical Momentum Forecast Model | March 2018


This Astronomical Momentum Forecast Model (AMFM) was inspired by the work of L.H. Weston, W.D. Gann and Chris Carolan. More than 120 years of US-stock market and detrended momentum data derived from a Williams %R oscillator were used, assuming this would reflect the overall sentiment and mass mood during the period. One fundamental concept of mundane astrology considers sentiment and mass mood to be conditioned and modulated by a complex set of nested, overlapping and repeating astronomical cycles, most important solunar cycles. These cycles are ranging from several decades to days and even minutes (Callipic Cycle, Metonic Cycle, Mythraic Cycle, Solar Cycles, Lunar Cycles, Planetary Hours, Muhūrta, etc.). They can be calculated into the past and future and hence be put into practical use. Considering the general nature, pros and cons of market momentum indicators, the AMFM is able to project market sentiment several decades into the future (see also HERE). Of course work on this model is experimental, not perfect and in progress. However, the current model presented here indicated a momentum peak in October 2017, a negative divergence at the January 27 major high, and suggests a decline from there into a major low around mid-March, followed by a rally into early May, a retest of the March-low by mid-June, another rally into early October, and a decline into end of December.

Friday, June 5, 2015

SPX vs North Node | Louise McWhirter's Theory of Stock Market Forecasting


Louise McWhirter presented her theory in 1938 in "Astrology and Stock Market Forecasting" (p. 7-8) as follows:

Whenever the North Node passes through Scorpio and Libra
[2012-2015], there is a transition period as the curve passes from normal, going from normal to high.

[…] The high point of business volume is reached when the North Node transits Leo
[2017-2018]. As the North Node goes through Cancer and Gemini, business volume is above normal, but slowly going to normal.

[…] Taurus
[2003-2004] is the transition point or normal point as the curve goes from normal to below normal in business volume.

[…] When the North Node enters Aquarius
[2007-2008], the low point of business activity has been reached. As the Node transits Capricorn [2009] and Sagittarius [2011], the normal position of the business curve is below normal going to normal.

[…] This is the natural position of the curve without the presence of secondary factors which can distort the curve favorably or unfavorably from one to twenty percent.

[…] The following secondary factors tend to lift the Business Curve:

(1) Jupiter conjunction the North Node.
[2009, 2016, 2023]
(2] Saturn trine, sextile, or semi-sextile Uranus.
[2002-2003, 2016-2017, 2025-2026]
(3) Jupiter in Gemini or Cancer.
[2000-2005, 2030-2035]
(4) Jupiter conjunction, sextile or trine Saturn and Uranus, when in aspect to each other.
(5) The North Node in Gemini.
[2013, 2016]
(6) Favorable aspects to Pluto.
[2013, 2016]

[…] The following secondary factors have been found to depress the Business Curve:

(1) Saturn conjunction, square or opposition the North Node.
[2013, 2016]
(2) Saturn conjunction, square, opposition, or semi-square Uranus.
[2012-2013, 2021]
(3) Saturn in Gemini. [2000-2003, 2030-2032]
(4) Uranus in Gemini.
[2025-2033]
(5) Uranus square, conjunction, or opposition the North Node.
[Jan 2015, Jun 2018]
(6) Unfavorable aspects to Pluto.
[Jan 2015, Apr 2019]

As the Node moved through Capricorn (2010) and Sagittarius (2011) the general economy approached a very high level of activity in Scorpio (2012), and should peak as the Node passes through the sign of Leo (2017). 

However, W.D. Gann associated the period of the Node in Libra (2015) also with stock market panics (HERE). Moving through the signs of Cancer (2018) and Gemini (2020), the economic activity is still positive but beginning to slow to more normal levels. 

The above chart of the SPX and the North Node in the zodiac signs clearly shows that in the past this basic theory was not always properly reflected in the stock market's movements. This has to do with other important astronomical cycles, e.g. the 19.86 Year Jupiter-Saturn Cycle, 19 Year Metonic Cycle, the different natured 18.61 Year Lunar Declination Cycle, the 18 Year Saros Cycle or the varying lengths of the Solar Cycle. Additional important "secondary factors" could be the amazing activities of central banks, especially during the past 40 years. Nevertheless, empirical research discovered a multitude of other interesting economic sub-cycles of 17 to 20 years length, never out-ruled by any human intervention. The Wave Length Index of the Foundation for the Study of Cycles lists the following:
 
Credits: Foundation for the Study of Cycles (1964): Catalogue of Cycles - Part I.

Sunday, January 25, 2015

60 Year Cycle in SPX (Similarity = 92%)

Correlation of last 250 trading days with the SPX from Sep. 1954 to Sep. 1955.
Calculated and charted with
Sergey Tarassov's Timing Solution
.
For the methodology see HERE
Source: Gann Global Financial, January 2015.

W.D. Gann (1936): Master Time Factor and Forecasting by Mathematical Rules, p. 218. See also HERE

Panic in the stockmarkets in fall 2015? See also HERE

Thursday, March 15, 2012

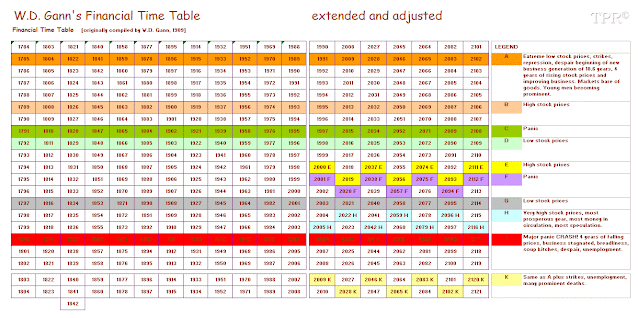
W.D. Gann's Financial Time Table 1784 - 2121 | Extended and Adjusted

 
Reportedly W.D. Gann constructed his legendary Financial Time Table on August 8th, 1908, without an ephemeris. Gann himself has been quoted as saying that this was his greatest market discovery. It is entirely based on the moon’s north node, which completes a full cycle every 18.6-years. This is the same cycle that Louise McWhirter used to predict the stock market as well. To mimic the Lunar Declination Cycle Gann simply alternated a sequence of +19, +18, +19, +18 etc.-years across the top to get an average length of 18.6-years. However, he finally noted that an adjustment would finally be due for Dec 25th, 1989. The above table adjusted the pattern to the ephemeris. 
 
The Financial Time Table predicts years of recessions, depressions, high stock prices, panics, low stock prices, speculative times, stock market crashes, labor strikes and so on. The legend at the right of the table reads as follows:
A - Extreme low stock prices, strikes, repression, despair, and beginning of new business generation for 18-3/5 years. 4 years of rising stock prices and improving business, markets bare of goods. Young men becoming prominent.
B - High stock prices.
C - Panic
D - Low stock prices.
E - High stock prices.
F - Panic
G - Low stock prices.
H - Very high stock prices most prosperous year, waste over extravagance, most money in circulation, much speculation.
J - Major Panic-CRASH! 4-years of falling prices, business stagnated, breadlines, soup kitchens, despair, and unemployment.
K - Same as A plus strikes, unemployment, many prominent deaths. 
W.D. Gann also observed what he came to call the decade cycle”. In his many commodity and stock market courses, he described the decade cycle this way: By studying the yearly high and low chart and going back over a long period of time, you will see the years in which bull markets culminate and the years in which bear markets begin and end.  Each decade, or 10-year cycle, which is one-tenth of 100 years, marks an important campaign… In referring to these numbers and these years, we mean the calendar years.  
 
To understand this, study 1891 to 1900, 1901 to 1910, 1911 to 1920, 1921 to 1930 and 1931 to 1939.  The ten year cycle continues to repeat over and over, but the greatest advances and declines occur at the end of the 20-year and 30year cycles, and again at the end of the 50-year and 60-year cycles, which are stronger than the others.
Year
1. A year in which a bear market ends and a bull market begins. 1901, 1911, 1921.
2. The second year is a year of a minor bull market, or a rally in a bear market will start at some time.  1902, 1912, 1922, 1932.
3. Starts a bear year, but the rally from the second year may run to March or April before culmination, or a decline from the 2nd year may run down and make bottom in February or March, like 1933.  1903, 1913, 1923.
4. The fourth year is a bear year, but ends the bear cycle and lays the foundation for a bull market.  Compare 1904, 1914.
5. The fifth year is the year of Ascension, and a very strong year for a bull market.  See 1905, 1915, 1925, 1935.
6. The sixth year is a bull year, in which a bull campaign which started in the fourth year ends in the Fall of the year and a fast decline starts.  See 1896, 1906, 1916, 1926.
7. Seven is a bear number and the seventh year is a bear year because 84 months or 840 degrees is 7/8ths of 90.  See 1897, 1907, 1917, but note 1927 was the end of a 60 year cycle, so not much of a decline.
8. The eighth year is a bull year.  Prices start advancing in the 7th year and reach the 90th month in the 8th year.  This is very strong and a big advance usually takes place.  Review 1898, 1908, 1918, 1928.  (2008 did not follow this pattern, which is where a little real estate cycle knowledge was helpful in this instance.)
9. Nine is the highest digit and the ninth year is the strongest of all for the bull markets.  Final bull campaigns culminate in this year after extreme advances and prices start to decline.  Bear markets usually start in September to November at the end of the 9th year and a sharp decline takes place.  See 1869, 1879, 1889, 1899, 1909, 1919 and 1929, the year of the greatest advances, culminating in the fall of that year, followed by a sharp decline.
10. Ten is a bear year.  A rally often runs until March and April; then a severe decline runs to November and December, when a new cycle begins and another rally starts.  See 1910, 1920, 1930.