S&P 500: Phased with an 18-month (or larger) trough in early April, 80-day trough mid-June (debated position due to fundamentals), 40-day trough mid-July, and recent subtle troughs suggesting a distorted 20-week cycle influenced by bullish longer cycles. Alternative analysis considers 20-week trough possibly formed on August 1st, but preferred view is it's ahead.
NASDAQ: Similar to S&P 500, with 18-month trough April 7th, 80-day trough slightly late (77 days, mid-June), 40-day trough August 1st (39 days, running long). Cycles averaging longer wavelengths; good match to price troughs.
NASDAQ (daily bars) and Composite Model (dashed orange line).
Gold: Sideways in wedge, testing $3,450 peak multiple times; synchronized peaks expected. Dual trough/peak analyses both valid: 40-week trough mid-May, 80-day trough July 30th (post-update), good FLD interactions (66.7% rating).
Trapped wedge suggests breakout imminent; combine trough/peak for composite. Higher peak at 20-week cycle (end August/early September), then potential upside continuation. Composite (dual) shows upward move post-20-day trough; expect FLD support.
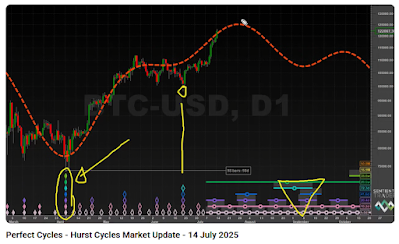
Bitcoin: 40-week trough mid-April, 80-day trough late June (clear), 40-day trough late (August 1st, expanded shorter cycles). Pure rhythms; similar to stocks, with bullish distortion.
Bitcoin: 40-week trough mid-April, 80-day trough late June (clear), 40-day trough late (August 1st, expanded shorter cycles). Pure rhythms; similar to stocks, with bullish distortion.
Watch 20-day FLD: support indicates early 20-week trough; cross below confirms ahead. Excessive bullishness (possible larger trough in April) pushes amplitudes higher. 20-week trough ahead (end August/early September), after bounce to potentially higher peak despite model showing lower. Cycles running long; amplitude least reliable, but wavelengths suggest decline post-peak.


.png)
.PNG)
%2018-month%20and%2054-month%20cycle%20peaks%20and%20troughs.PNG)


