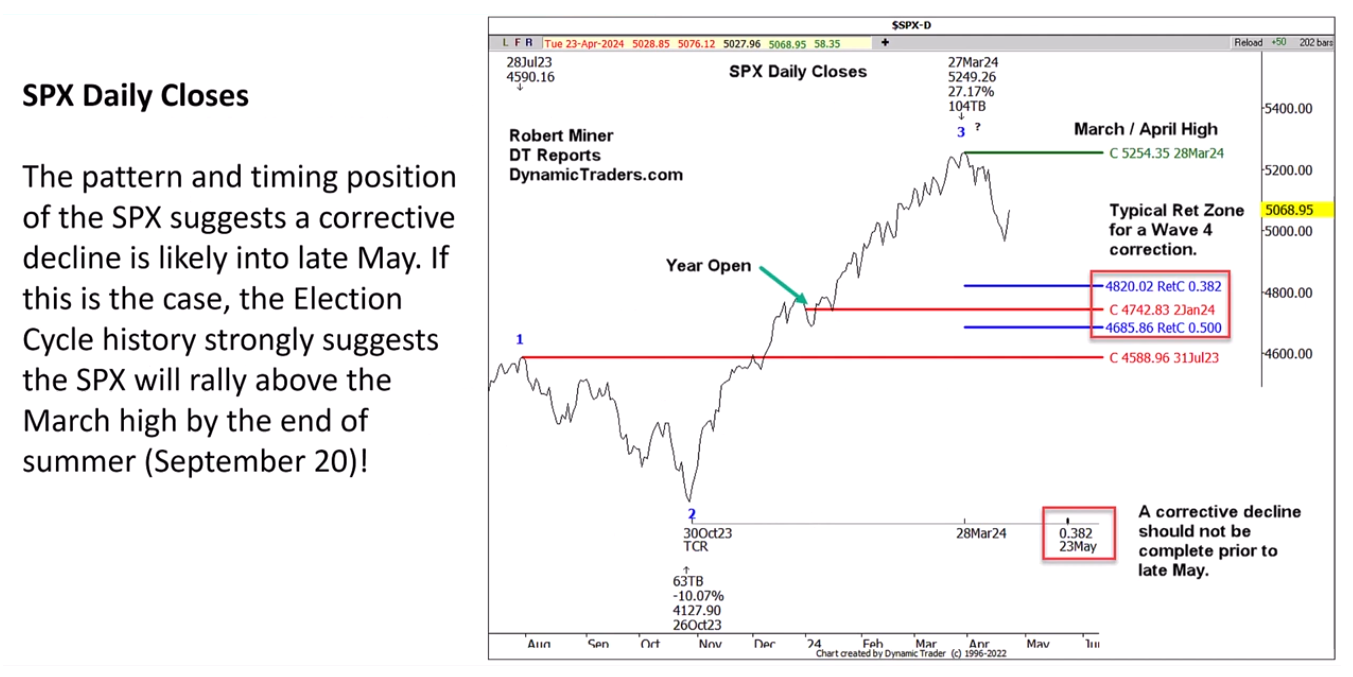
I am recording this on April 25th and am going to talk about the S&P 500 and the election cycle today. [...] Within the next three weeks there is going to be one of the best setups within the entire election cycle. This is a setup that since 1952 had only one minor losing year (less than -1%).

In the above chart the dark black line is the average of all election years since 1952. The gray line is the average of all election years since 1984. The red line is 2024 up to past week.

[...] The second chart just covers the beginning of March through September period of the election years. The blue line is the average of all election years since 1952. In the first chart we saw the entire year, where the first part of the year is usually fairly negative. On average, we can see this distinct dip into the middle of May.

[...] Here are just two key pieces of information from the election year study from the spring until the end of summer. Number one, the 'summer low' is usually made around the second half of May to the first half of June. So that summer low probably hasn't been made yet. It sort of implies that the S&P is likely to be sideways to down into the second half of May. At least that is based on the averages of election years. Number two, in every election year, when the first quarter was strongly bullish (which it was in 2024), the S&P traded above the March high by September 20th - except for the year 2000, when the summer high came within just seven points of the March high by September 20th.
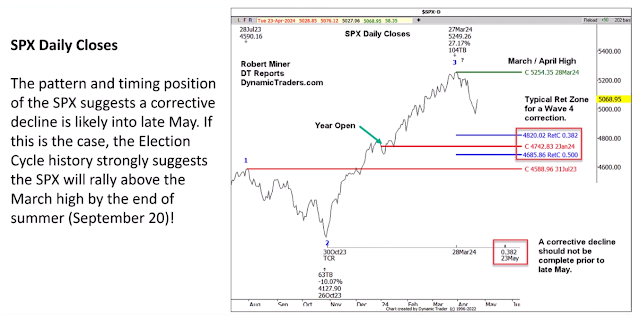
If the S&P happens to be sideways to down for the next few weeks, we know that the bias is overwhelmingly strong and bullish and that the S&P should then trade above the March high before September 20th. The March high was the high of the year so far, and it is more than likely that the S&P will go sideways to down in the next few weeks. A correction would not be complete prior to May 23rd to 38% time retracement.

[...] The second chart just covers the beginning of March through September period of the election years. The blue line is the average of all election years since 1952. In the first chart we saw the entire year, where the first part of the year is usually fairly negative. On average, we can see this distinct dip into the middle of May.

[...] Here are just two key pieces of information from the election year study from the spring until the end of summer. Number one, the 'summer low' is usually made around the second half of May to the first half of June. So that summer low probably hasn't been made yet. It sort of implies that the S&P is likely to be sideways to down into the second half of May. At least that is based on the averages of election years. Number two, in every election year, when the first quarter was strongly bullish (which it was in 2024), the S&P traded above the March high by September 20th - except for the year 2000, when the summer high came within just seven points of the March high by September 20th.
If the S&P happens to be sideways to down for the next few weeks, we know that the bias is overwhelmingly strong and bullish and that the S&P should then trade above the March high before September 20th. The March high was the high of the year so far, and it is more than likely that the S&P will go sideways to down in the next few weeks. A correction would not be complete prior to May 23rd to 38% time retracement.


