What he found was a high correlation between the S&P 500’s returns from November 19th to the following January 19th and the S&P’s performance over the 12 months following January 19. Since the 2-month period straddled the turn of the year and the gift-giving season, he called it the TOY Barometer [...] (If Nov 19 falls on a weekend, use the Monday after the weekend, and if Jan 19 falls on a weekend, use the Friday before.) He only considered the price-only return (no dividends). If the return during this 2-month period was greater than 3%, a bullish signal was given, and the market was very likely to do well over the following 12 months. If the return was between 0-3%, the signal was considered neutral, and results were somewhat random, aligning with what is considered average. If the return was negative, a bearish signal was given, and returns tended to be very poor.
Since 1950, there have been 36 bullish signals (including the one that just triggered), 19 neutral signals, and 16 bearish signals [as of Jan 22, 2020]. Let’s look at each signal group.
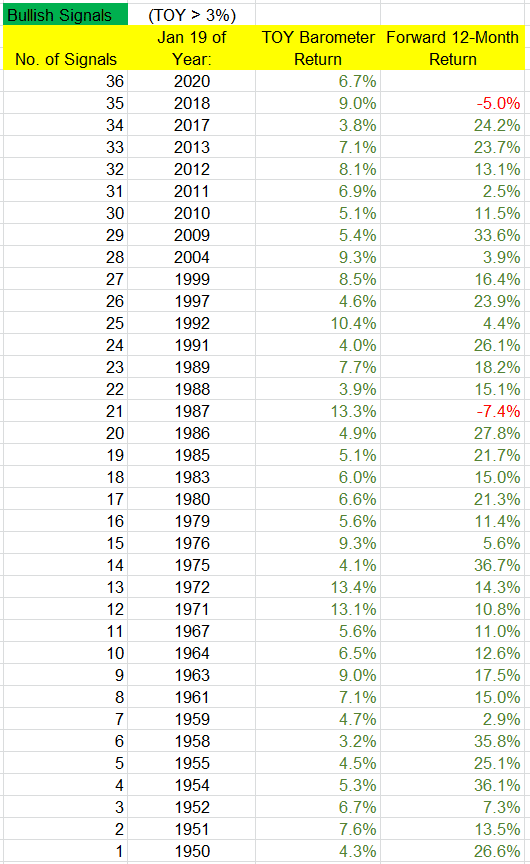
Bullish Signals: The 35 completed bullish signals have led to gains 33 times in the following 12 months. The losses occurred in 1987, the year of one of the biggest single-day crashes in history, and in 2018, a year that included a 20% drop during the fourth quarter. The average and median gains of the 12 months following the bullish signals were 17.7% and 15.1%. This isn’t much better than the “all years” stats, but the win rate (94%) is much higher than the “all years” win rate (73%).

Neutral Signals: There have been 19 neutral signals. The following year was positive 12 times (63%), compared to a 73% win rate for “all years.” The overall average and median returns were 6.0% and 7.1%. But among the “up” years, the average and median gains were 14.4% and 9.4%, while the “down” years’ average and median losses were -8.5% and -7.8%. There were several big up years (1995, 1996, 1998, 2003), and two big down years (1973, 1977), so even if there is a neutral signal, there’s still a decent chance the following 12 months will venture far from its January 19 print.

Bearish Signals: There have been 16 bearish signals. Only 6 (38%) of the following years posted a gain, while 10 posted losses – and 6 of those 10 posted double-digit losses. The overall average and median returns were -3.6% and -6.0%. The “up” years posted average and median gains of 14.6% and 15.5%, while the “down” years posted average and median losses of -14.6% and -12.9%. So, despite the low win rate, when the market does well, it has the ability to do very well, as was the case this past year.
Summary:
The bullish years have a very high win rate (94% vs 73% for “all
years”). The average gain (17.7%) isn’t much higher than the “all years”
gain (16.6%), so a bullish signal increases the odds of an up year but
doesn’t increase the gain itself.
The bearish years have a low win rate (38%). The gains during those
up years (14.6% vs 16.6% for all years) are very good, but the losses
during the down years are noticeably bigger than when a bullish or
neutral signal is signaled (-14.6% vs -6.2% for bullish years and vs
-8.5% for neutral years). So the odds of a down year are much higher,
and the losses that follow are much bigger.
The neutral years are mixed. The win rate is 63% (vs 72% for “all
years”), with the gains during up years being pretty good (14.2% vs
16.6% for “all years”) and the losses during down years being moderate
(a little worse than bullish years but much better than bearish years).
[...] When a bullish signal is in play, odds heavily favor
solid gains over the following 12 months, but when there’s a bearish
signal, odds favor a down year with a relatively big loss. But
regardless of the signal, “up” years tend to be very good.
Quoted from: