Neutral Signals: There have been 19 neutral signals. The following year was positive 12 times (63%), compared to a 73% win rate for “all years.” The overall average and median returns were 6.0% and 7.1%. But among the “up” years, the average and median gains were 14.4% and 9.4%, while the “down” years’ average and median losses were -8.5% and -7.8%. There were several big up years (1995, 1996, 1998, 2003), and two big down years (1973, 1977), so even if there is a neutral signal, there’s still a decent chance the following 12 months will venture far from its January 19 print.

Bearish Signals: There have been 16 bearish signals. Only 6 (38%) of the following years posted a gain, while 10 posted losses – and 6 of those 10 posted double-digit losses. The overall average and median returns were -3.6% and -6.0%. The “up” years posted average and median gains of 14.6% and 15.5%, while the “down” years posted average and median losses of -14.6% and -12.9%. So, despite the low win rate, when the market does well, it has the ability to do very well, as was the case this past year.

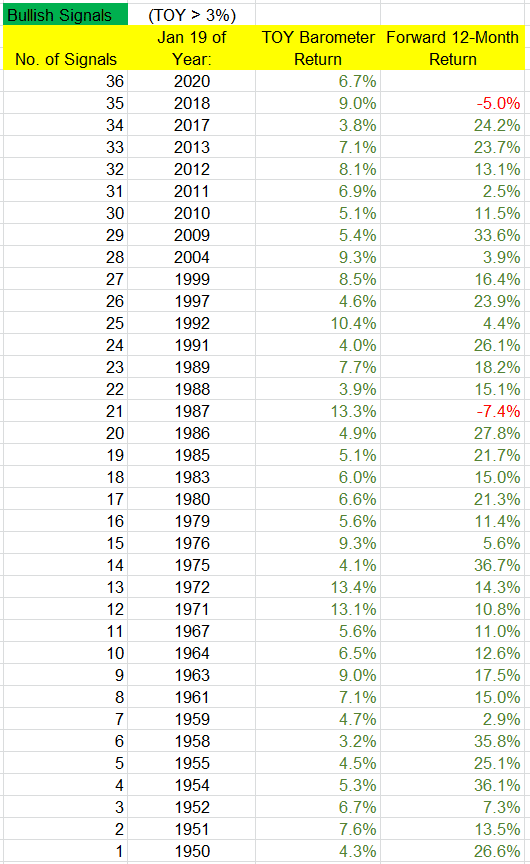
[...] When a bullish signal is in play, odds heavily favor solid gains over the following 12 months, but when there’s a bearish signal, odds favor a down year with a relatively big loss. But regardless of the signal, “up” years tend to be very good.

Steve Deppe (Nov 19, 2015) - Maximizing Returns With Wayne Whaley’s TOY Barometer.
Steve Deppe (Jan 20, 2016) - Whaley’s “TOY Barometer” Sends Bearish Signal To Investors.
Taylor Dart (Jan 07, 2019) - S&P 500: One Study Worth Paying Attention To.
Seth Golden (Jan 19, 2021) - State of the Market: Historic Data Studies Offer A Guide.
Leavitt Brothers (2022) - Wayne Whaley's TOY Barometer.


%20-%20Price%20and%20Market%20Structures%20-%20Summary%20%5B2%20p.%5D-2.png)
%20-%20Price%20and%20Market%20Structures%20-%20Summary%20%5B2%20p.%5D-1.png)