Thursday, January 12, 2023

Understanding the Real Economy | Martin A. Armstrong

Big Fish Eat Little Fish - Pieter Bruegel the Elder, 1556

The Economic Confidence Model that I discovered back in the 1970s was not based on any particular market or economy. It was devised by taking a list of world panics in the economy, irrespective of where they began, utilizing a list of 26 events between 1683 and 1907. It was dividing 26 into the 224 year time period that produced the basic frequency of 8.615384615. Like Adam Smith, I set out upon a course of observation to try to understand what made a cycle even exist. Through the course of my studies of the past and observations of the present, I came to realize that the observations uncovered a rich and dynamic structure of interactivity between mankind himself, as well as nature from weather to earthquakes. In short, what scientists were just then discovering with the aid of computers that could do millions of calculations impossible by hand, that the image of chaos has been completely altered. What may appear to be chaos, is in reality, only complex interaction that can be observed by only pealing back layers upon layers like an onion.
 
Written by Martin Armstrong on a type-writer while imprisioned in FCI, Fort Dix, New Jersey, 2009.

[...] Now that we understand what makes one economy boom against all others, or a particular sector within an economy because Capital Concentrates, now we can look at the ECM with the proper perspective. This is a global model of economic activity that highlights the raw fact that man will speculate no matter what and that creates the Capital Concentration. The ECM gives us the perspective of short-term business cycle movements at the 8.615384615 year level, but this frequency moved both up and down in time in layers like an onion. It builds into groups of 6 waves forming a 51.6 year major cyclical wave where confidence between the people and the state alternate at the generational level. This builds into 6 waves again of 51.6 years into 309.6 year waves upon which nations rise and fall.
 
 
[...] There are those who no matter what you show them or what you say they will never believe in cycles. For those of us who do, we need that disbelief to trade against. There always has to be two sides to a coin, as well as a market.


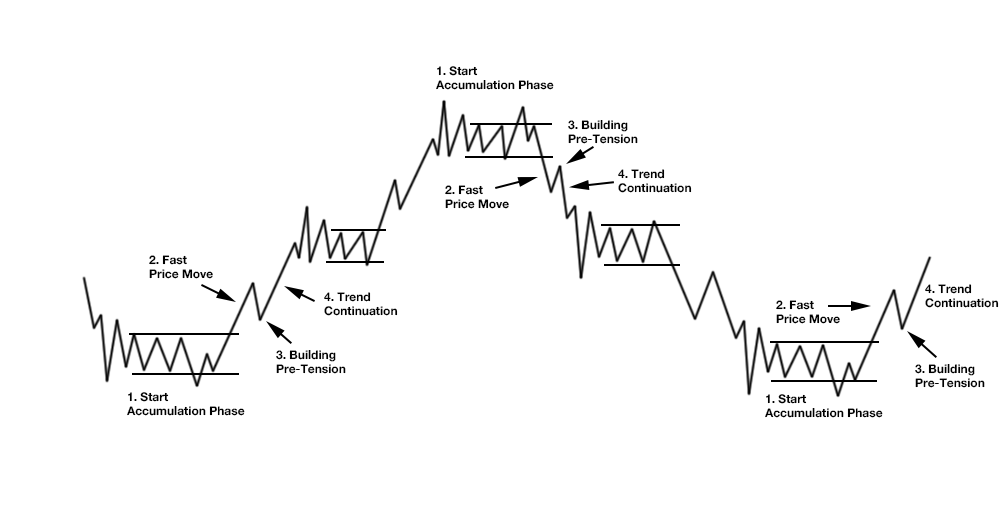
[...] Look a major collapses from all bubble tops and this is what you will find. The minimum amount of time to complete the fall and decline is this 31-34 month time period except in the Waterfall Events.

[...] There has been a lot written about the Science of Chaos. The true person to develop this field was B. Mandelbrot. The science of chaos that produced the fractal geometry I regard from a pure economic perspective as a proof of the existence of layers upon layers, but it offers no predictive value for our real economy in the traditional sense.

 
[...] What fractal geometry demonstrates is that there is no real just chaos, just such degree of complexity that our eye has been unable to see the complex order. Fractal Geometry and its insights is based upon Complex Numbers. For those who do not remember the school days, unlike all other numbers, the Complex Numbers do not exist on a horizontal plane. The Natural Numbers 1 through 9, for example, can be plotted on a horizontal line.
 

[...]
Unlike Natural Numbers, Complex Numbers do not exist on a horizontal line. They exist only on an x-y coordinate time plane where Natural Numbers and Regular Numbers on a horizontal grid combine into what we call Imaginary Numbers on the vertical grid. These Imaginary Numbers are simply numbers where taking a negative number times another negative number produces a negative instead of a positive number, i.e. -2 * -2 = -4.


[...]
We can see from the above illustration of the Economic Confidence Model that there has always been a delicate dance between the effects that follow the path of “time” as the Fourth Dimension adds to the basic equation What-How-Where with the fourth variable “When” and now we have the hidden complex field behind everything that adds the next portion to the equation “Why” that can be explained only by the Fifth Dimension of complex interaction through the process of “self-referral” that allows history to repeat. We are getting closer to the real causes and effects that have tormented mankind and often caused such hardship by the attribution of normal events to the folly of gods.


See also:

Monday, January 9, 2023

External & Internal Range Liquidity | GhostTraders

External Range Liquidity is the liquidity that will be resting on previous highs and lows (these highs and lows are also used to define the range), this could be in the form of stops or pending orders. While Internal Range Liquidity is the liquidity inside the defined range (External Range Liquidity). This could be in form of any institutional reference that we can use as entry such as order blocks, fair value gaps, volume imbalance, and more.

HERE

The first thing to do to be able to identify external range liquidity and internal range liquidity is to define the range you will be working within, using swing highs and lows to mark the beginning and end of the range. Choose the recent trading range relative to your specific time frame when defining your range.


External Range Liquidity can act as a draw on liquidity based on order flow, meaning if we have external range liquidity on the previous low and the institutional order flow is bearish, price will be attracted or pulled towards our external range.
 

Wednesday, January 4, 2023

The Turn of the Year (TOY) Barometer | Wayne Whaley

Jason Leavitt (Jan 22, 2020) - According to Wayne Whaley, the most predictive period of the year is November 19 to January 19. He considers this period to be the single most reliable seasonality barometer of forward stock market returns – so much so that he’s said if he could only make one trade/year based on one indicator, this is the indicator he’d use. Whaley’s goal was to identify what he called the "kingpin of seasonal barometers." He stated: "I implored my computer to take a few seconds to exhaustively study S&P performance over every time period of the year and determine which time frame’s behavior was proprietor of the highest correlation coefficient relative to the following year’s performance."
 

What he found was there was a high correlation between the S&P 500’s returns between November 19th and the following January 19th and the S&P’s performance the 12 months following January 19. And since the 2-month period straddled the turn of the year and the gift giving season, he called it the TOY Barometer [...] if Nov 19 is on a weekend, use the Monday after the weekend, and if Jan 19 is on a weekend, use the Friday before). He only considered the price-only return (no dividends). If the return during this 2-month period was greater than 3%, a bullish signal was given, and the market was very likely to do well over the following 12 months. If the return was 0-3%, the signal was considered neutral, and results were somewhat random and in line with what is considered average. And if the return was negative, a bearish signal was given, and returns tended to be very poor.
 
Since 1950, there have been 36 bullish signals (including the one that just triggered), 19 neutral signals and 16 bearish signals [as of Jan 22, 2020]. Let’s look at each signal group.

Bullish Signals:    The 35 completed bullish signals have led to gains 33 times the following 12 months. The losses were in 1987, the year of one of the biggest single-day crashes in history, and 2018, that year that included a 20% drop during the fourth quarter. The average and median gains of the 12 months following the bullish signals were 17.7% and 15.1%. This isn’t much better than the “all years” stats, but the win rate (94%) is much higher than the “all years” win rate (73%). 
 

Neutral Signals:    There have been 19 neutral signals. The following year was positive 12 times (63%), compared to 73% win rate for “all years.” The overall average and median returns were 6.0% and 7.1%. But among the “up” years, the average and median gains were 14.4% and 9.4%, while the “down” years’ average and median losses were -8.5% and -7.8%. There were several big up years (1995, 1996, 1998, 2003), and two big down years (1973, 1977), so even if there is a neutral signal, there’s still a decent chance the following 12 months will venture far from its January 19 print.

Bearish Signals:    There have been 16 bearish signals. Only 6 (38%) of the following years posted a gain while 10 posted losses – and 6 of those 10 posted double digit losses. The overall average and median returns were -3.6% and -6.0%. The “up” years posted average and median gains of 14.6% and 15.5%, while the “down” years posted average and median losses of -14.6% and -12.9%. So despite the low win rate, when the market does well, it has the ability to do very well, as was the case this past year.

Summary:     
The bullish years have a very high win rate (94% vs 73% for “all years”). The average gain (17.7%) isn’t much higher than the “all years” gain (16.6%), so a bullish signal increases the odds of an up year but doesn’t increase the gain itself. 
 
The bearish years have a low win rate (38%). The gains during those up years (14.6% vs 16.6% for all years) are very good, but the losses during the down years are noticeably bigger than when a bullish or neutral signal is signaled (-14.6% vs -6.2% for bullish years and vs -8.5% for neutral years). So the odds of a down year are much higher, and the losses that follow are much bigger. 
 
The neutral years are mixed. The win rate is 63% (vs 72% for “all years”), with the gains during up years being pretty good (14.2% vs 16.6% for “all years”) and the losses during down years being moderate (a little worse than bullish years but much better than bearish years).

[...] When a bullish signal is in play, odds heavily favor solid gains over the following 12 months, but when there’s a bearish signal, odds favor a down year with a relatively big loss. But regardless of the signal, “up” years tend to be very good.


Quoted from:
 
See also
 

Monday, January 2, 2023

The Blue Church, the Blue Faith & Red Pills for 2023 | Jordan Hall

This is the formal core of the Blue Church: 
 
it solves the problem of 20th Century social complexity through the use of mass media to generate manageable social coherence.
 
The abstract is this: 
 
the Blue Church is a kind of narrative / ideology control structure that is a natural result of mass media. It is an evolved (rather than designed) function that has come over the past half-century to be deeply connected with the Democratic political “Establishment” and lightly connected with the “Deep State” to form an effective political and dominant cultural force in the United States.

We can trace its roots at least as far back as the beginning of the 20th Century where it emerged in response to the new capabilities of mass media for social control. By mid-century it began to play an increasingly meaningful role in forming and shaping American culture-producing institutions; became pervasive through the last half of the 20th and seems to have peaked in its influence somewhere in the first decade of the 21st Century.

It is now beginning to unravel.


In part it is unravelling because of developing schisms within its master narrative, the Blue Faith. These are important, but they are not the subject of this essay. In this essay, I am focusing on what I think is both much more fundamental and much less obvious: deep shifts in technology and society that are undermining the very foundations of the Church. Shifts that render the Church itself obsolete. 
If you are ready for a deep dive, come on in. The water is warm.

Wednesday, December 21, 2022

Accumulation & Distribution Schematics | Richard D. Wyckoff


An understanding of manipulative procedure in any-event helps us to judge the motives, the hopes, fears and, aspirations of all the buyers and sellers whose actions today have the same net effect upon the market as 30 many pool operations would have. So if we are squeamish about the term "manipulator" we may substitute the words "Composite Operator" with the same force and affect. Some people might object to this statement on the ground that regulation of the stock market has eliminated pool operations. Even though pool operations and old-fashioned manipulation are banned by law, for our purpose in studying, understanding and correctly interpreting market action, we must consider any operation a "manufactured" movement wherein the buying or the selling is sufficiently concerted and coming from interests better informed than the public as to produce the same effects as pure manipulation. 

[...] The market is made by the minds of men, and all the fluctuations in the market and in all the various stocks should be studied as if they were the result of one man’s operations. Let us call him the Composite Man, who, in theory, sits behind the scenes and manipulates the stocks to your disadvantage if you do not understand the game as he plays it; and to your great profit if you do understand it.

Great activity and breadth induces trading in large quantities by big operators on the floor and outside. Such a market enables the manipulator to unload a large line of stock. When he wishes to accumulate a line, he raids the market for that stock, makes it look very weak, and gives it the appearance of heavy liquidation by sending in selling orders through a great number of brokers.

You say all this is unethical, if not unscrupulous. You say it is a cruel and crooked game. Very well. Electricity can be very cruel, but you can take advantage of it; you can make it work for your benefit. Just so with the stock market and the Composite Man. Play the game as he plays it. I am giving you the inside view.


See also:


Range Extension & Contraction - Reversals - Time Cycles | Stacey Burke

 
oOo
 
Old Baron Rothschild's recipe for wealth winning applies with greater force than ever to speculation. Somebody asked him if making money in the Bourse was not a very difficult matter, and he replied that, on the contrary, he thought it was very easy. "That is because you are so rich," objected the interviewer. "Not at all. I have found an easy way and I stick to it. I simply cannot help making money. I will tell you my secret if you wish. It is this : I never buy at the bottom and I always sell too soon."

Jesse L. Livermore

oOo

Quoted from:
 
See also:
 
Weekly Cycle and Market Structure in Gold (1 hour chart):
Daily and Weekly Highs and Lows, Daily and Weekly Pivot Levels, Inside Days, Outside Days,
Daily and Weekly Accumulation-, Extension-, and Distribution-Levels, Breakouts, False Breakouts,
V Patterns, M & W Patterns, Peak Formation Highs and Lows.

Friday, December 16, 2022

The Four Guiding Principles of Market Behavior | Momentum & Trend

Principle 1:     Trend is More Likely to Continue its Direction than to Reverse
With price established in a clearly defined trend of higher highs and higher lows, certain key strategies and probabilities begin to take shape. Once a trend is established, it takes considerable force and capitalization to turn the tide. Fading a trend is generally a low-probability endeavor and the greatest profits can be made by entering reactions or retracements following a counter trend move and playing for either the most recent swing high or a certain target just beyond the most recent swing high. An absence of chart patterns or swings implies trend continuation until both a higher high and a higher low (vice versa for uptrend changes) form and price takes out the most recent higher high.

Be aware that recent statistical analysis of market action (from intraday to 20 day periods) over the last five years shows that mean reversion, rather than trend continuation is more probable in many equities/indices (as shown by more up days followed by down days than continuation upwards). For the current market environment, until volatility returns (as it may be doing now), this rule may be restated, “Trends with strong momentum show favorable odds for continuation.”
 
Principle 2:     Trends End in Climax (Euphoria/Capitulation)
Trends continue in push/pull fashion until some external force exerts convincing pressure on the system, be it in the form of sharply increased volume or volatility. This typically occurs when we experience extreme continuity of thought and euphoria of the mass public (that price will continue upwards forever). However, price action – because of extreme emotions – tends to carry further than most traders anticipate, and anticipating reversals still can be financially dangerous. In fact, some price action becomes so parabolic in the end stage that up to 70% of the gains come in the final 20% of the move. Markets also rarely change trends overnight; rather, a sideways trend or consolidation is more likely to occur before rolling over into a new downtrend.
 
Three Things Markets do:
1. Breakout and Trend.
2. Breakout and Reverse (False Breakout).
3. Trading Range (High and Low).
 
 
Principle 3:     Momentum Precedes Price
Momentum – force of buying/selling pressure – leads price in that new momentum highs have higher probability of resulting in a new price high following the next reaction against that momentum high. Stated differently, expect a new price high following a new momentum high reading on momentum indicators (including MACD, momentum, rate of change). A gap may also serve as a momentum indicator. Some of the highest probability trades occur after the first reaction following a new momentum high in a freshly confirmed trend. Also, be aware that momentum highs following a trend exhaustion point are invalidated by principle #2. Never establish a position in the direction of the original trend following a clear exhaustion point.
 
Principle 4:     Price Alternates Between Range Expansion and Range Contraction
Price tends to consolidate (trend sideways) much more frequently than it expands (breakouts). Consolidation indicates equilibrium points where buyers and sellers are satisfied (efficiency) and expansion indicates disequilibrium and imbalance (inefficiency) between buyers and sellers. It is much easier to predict volatility changes than price, as price-directional prediction (breakout) following a low-volatility environment is almost impossible. Though low volatility environments are difficult to predict, they provide some of the best risk/reward trades possible (when you play for a very large target when your initial stop is very small – think NR-7 Bars).

Various strategies can be developed that take advantages of these principles. In fact, almost all sensible trades base their origin in at least one of these market principles: breakout strategies, retracement strategies, trend trading, momentum trading, swing trading, etc. across all timeframes.
 
Concept Credit for arranging the four principles
 
See also:
 

Wednesday, December 14, 2022

Year-End Rally, January Influence & Trend For The Year | Jack Gillen

Jack Gillen (2009) - The Sun's position in relation to the stock market can show trends that are more or less active for each year, as the Sun degrees are generally fixed — they fall on about the same date every year. This is why some periods of the year reflect more of a pattern. This means that the Dow Jones Industrial Average will have similar to the same patterns at different sensitive points throughout each year. 
 
 
As an example, Iet’s take the natal chart of the NYSE and the U.S. chart. In the NYSE chart we find Venus, a prominent planet, along with Jupiter, relating to moves of success. The Sun is trine Venus at 5 degrees Taurus with the Sun at 5 degrees Virgo or 5 degrees Capricorn. This would relate to a sensitive point from the transit of the Sun to the NYSE chart. But in the US chart we have Jupiter at 5 degrees Cancer (the opposition of Cancer is Capricorn) so the transit at 5 degrees Capricorn would affect the market during that orb which would last from 5 degrees through 9 degrees, a 4-degree orb. This orb is in effect around Christmas and has become known as the year-end rally. The percentages are thus strongly in the favor as far as the Dow Jones coming up on the plus side from Christmas Day to New Year's Day. This trend is more or less dominant year after year.
 

[...] Regarding the trend for the year, January can give a good indication because of the later degree sensitive points (Venus in Taurus, and Mars and Neptune in Virgo). This means that January can indicate what the eleven months ahead are going to be, bearish or bullish. Research reveals the success rate to be about 80 percent. This does not work when there are crash periods, certain sensitive zones activated in panics and crashes. This will bring some turmoil, as will Saturn going through Capricorn, which also indicates delays. This is very helpful in determining what an individual stock will do, but there are three factors you need to learn in order to determine which stock to start with for the year. In most cases it’s better to buy a stock at the beginning of the year and ride with it because you can get a pretty good indication of the January influence.

Why is the January influence so important? Astrologically speaking, there is the trine aspect related to the year-end rally period. But it’s more than that. We have Venus at 5 degrees Taurus, Mercury at 23 degrees Taurus and the Sun at 27 degrees Taurus, and Mars at 18 degrees Virgo. These points are trine Capricorn. So January is important because there is a grand trine, a configuration that occurs when there arc three planets, each 120 degrees apart. As the Sun leaves the 5 degree Capricorn point that relates to the short rally it moves on to a trine to the NYSE Mars at 18 degrees, the NYSE Mercury at 23 degrees and NYSE Sun at 27 degrees. So this is why January is important in anything related to the Dow Jones Industrial Average. The trine also occurs in the U.S. chart with Neptune at 24 degrees Virgo and the Part of Fortune at 25 degrees Taurus. But the opposition to planets in Cancer show a turning point: and Capricorn rules government. These influences can be seen from about January 9 through January 18, as the Sun transits the pertinent degrees. If the market shoots up in January, it will be up in December; if it’s low in January, then it's going to be low in December, at year's end.
 

The Moon-Stats | Jack Gillen

Jack Gillen (2002) - There is a Moon statistic that falls into the 70 - 100 percent group but is closer to the 70 percent group, and that’s the Moon’s transit from Virgo to Pisces
 
Virgo to Pisces Moon Cycle 2019 - 2026
 
Therefore, if you are looking to go long with a stock it’s best to start during this period. For instance, in the year 2003, on the tables we have January 21st - February 3rd. This is indicating that at the closing price of January 21st would represent the Moon in Virgo, and the fact that you can have a big drop in the market with the Moon in Virgo, is the reason this is based on the closing price. Therefore, by going long during this period it is indicating to you there is a 70 percent chance that on February 3rd the Dow Jones Industrial Average will be higher [...] and if you have a stock you want to short, your best chance would be from the sign of Pisces to Virgo.
 
Quoted from:
Jack Gillen (2002) - AstroStats for the New York Stock Exchange.
 

The Mercury-Stats | Jack Gillen

Jack Gillen (2002) - Mercury goes retrograde approximately three times a year and causes a state of confusion, and after it goes back direct the market can explode into a bear or bullish market.
 
Mercury Retrograde

[...] in those years when Mercury is retrograding there is an 85 percent chance that the DJIA price at the time it goes direct will be higher than when it was retrograding. The same is true when Mercury is retrograding in the sign of Capricorn, which holds the same accuracy rate as the ten-year cycle from 1885. In the Mercury retrograde period, those dates in bold print have a 70 - 80 percent accuracy of having a higher Dow Jones price at the end of the retrograde cycle.

Quoted from:
Jack Gillen (2002) - AstroStats for the New York Stock Exchange.
 
See also:
Jack Gillen (2009) - The Key to Speculation on the New York Stock Exchange (2nd Ed.).
AstroSeek.com (2022) - Retrograde Planets 2022.