(Percentages updated for 2023).
Reference:


| Date | Sun's Longitude Position | Effect on US Stock Indexes |
| 2023 12 08 (Fri) | = SUN @ 16 SAG = 256 degrees | negative = low |
| 2023 12 12 (Tue) | = SUN @ 20 SAG = 260 degrees | negative |
| 2023 12 16 (Sat) | = SUN @ 24 SAG = 264 degrees | positive = high |
| 2023 12 28 (Thu) | = SUN @ 6 CAP = 276 degrees | positive |
| 2024 01 02 (Tue) | = SUN @ 11 CAP = 281 degrees | positive |
| 2024 01 06 (Sat) | = SUN @ 16 CAP = 286 degrees | negative |
| 2024 01 19 (Fri) | = SUN @ 29 CAP = 299 degrees | negative |
| 2024 01 30 (Tue) | = SUN @ 10 AQU = 310 degrees | positive |
| 2024 02 03 (Sat) | = SUN @ 14 AQU = 314 degrees | positive |
| 2024 02 06 (Tue) | = SUN @ 17 AQU = 317 degrees | negative |
| 2024 02 18 (Sun) | = SUN @ 29 AQU = 329 degrees | negative |
| 2024 02 23 (Fri) | = SUN @ 4 PIS = 334 degrees | negative |
| 2024 02 24 (Sat) | = SUN @ 5 PIS = 335 degrees | negative |
| 2024 03 03 (Sun) | = SUN @ 13 PIS = 343 degrees | positive |
| 2024 03 11 (Mon) | = SUN @ 21 PIS = 351 degrees | positive |
| 2024 03 24 (Sun) | = SUN @ 4 ARI = 4 degrees | positive |
| 2024 03 31 (Sun) | = SUN @ 11 ARI = 11 degrees | positive |
| 2024 04 07 (Sun) | = SUN @ 18 ARI = 18 degrees | negative |
| 2024 04 13 (Sat) | = SUN @ 24 ARI = 24 degrees | negative |
| 2024 04 26 (Fri) | = SUN @ 6 TAU = 36 degrees | negative |
| 2024 05 01 (Wed) | = SUN @ 12 TAU = 42 degrees | neutral |
| 2024 05 08 (Wed) | = SUN @ 18 TAU = 48 degrees | negative |
| 2024 05 19 (Sun) | = SUN @ 19 TAU = 59 degrees | neutral |
| 2024 05 25 (Sat) | = SUN @ 5 GEM = 65 degrees | negative |
| 2024 06 06 (Thu) | = SUN @ 16 GEM = 76 degrees | neutral |
| 2024 06 07 (Fri) | = SUN @ 17 GEM = 77 degrees | negative |
| 2024 06 08 (Sat) | = SUN @ 18 GEM = 78 degrees | neutral |
| 2024 06 29 (Sat) | = SUN @ 8 CAN = 98 degrees | positive |
| 2024 07 04 (Thu) | = SUN @ 13 CAN = 103 degrees | negative |
| 2024 07 07 (Sun) | = SUN @ 16 CAN = 106 degrees | positive |
| 2024 07 10 (Wed) | = SUN @ 18 CAN = 108 degrees | negative |
| 2024 07 24 (Wed) | = SUN @ 2 LEO = 122 degrees | negative |
| 2024 07 29 (Mon) | = SUN @ 6 LEO = 126 degrees | positive |
| 2024 08 09 (Fri) | = SUN @ 17 LEO = 137 degrees | negative |
| 2024 08 10 (Sat) | = SUN @ 18 LEO = 138 degrees | positive |
| 2024 09 02 (Mon) | = SUN @ 10 VIR = 160 degrees | negative |
| 2024 09 04 (Wed) | = SUN @ 12 VIR = 162 degrees | positive |
| 2024 09 05 (Thu) | = SUN @ 13 VIR = 163 degrees | negative |
| 2024 09 20 (Fri) | = SUN @ 28 VIR = 178 degrees | positive |
| 2024 09 24 (Tue) | = SUN @ 2 LIB = 182 degrees | negative |
| 2024 10 07 (Mon) | = SUN @ 14 LIB = 194 degrees | negative |
| 2024 10 14 (Mon) | = SUN @ 21 LIB = 201 degrees | positive |
| 2024 10 22 (Tue) | = SUN @ 29 LIB = 209 degrees | positive |
| 2024 10 25 (Fri) | = SUN @ 2 SCO = 212 degrees | negative |
| 2024 10 27 (Sun) | = SUN @ 4 SCO = 214 degrees | negative |
| 2024 11 03 (Sun) | = SUN @ 11 SCO = 221 degrees | positive |
| 2024 11 21 (Thu) | = SUN @ 29 SCO = 239 degrees | positive |
| 2024 11 25 (Mon) | = SUN @ 3 SAG = 243 degrees | positive |
| 2024 12 08 (Sun) | = SUN @ 16 SAG = 256 degrees | negative |
| 2024 12 12 (Thu) | = SUN @ 20 SAG = 260 degrees | negative |
| 2024 12 15 (Sun) | = SUN @ 24 SAG = 264 degrees | positive |
| 2024 12 27 (Fri) | = SUN @ 6 CAP = 276 degrees | positive |
| 2025 01 01 (Wed) | = SUN @ 11 CAP = 281 degrees | positive |
| 2025 01 06 (Mon) | = SUN @ 16 CAP = 286 degrees | negative |
| 2025 01 19 (Sun) | = SUN @ 29 CAP = 299 degrees | negative |
| 2025 01 30 (Thu) | = SUN @ 10 AQU = 310 degrees | positive |
| 2025 02 03 (Mon) | = SUN @ 14 AQU = 314 degrees | positive |


.png)


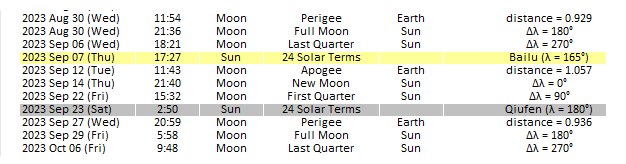
 primetimes2.com - Cycle of Solunar Forces in December, 2023.


%20@%20X.jpg)