Saturday, June 29, 2024

How fast Superpowers can Collapse

In early 1991, Soviet citizens voted on the New Union Treaty which proposed to reform-rather than dissolve-the USSR. 76% of Soviet voters ultimately supported maintaining the federal system of the Soviet Union, including a majority in nine of the 15 republics. A year later, however, the USSR didn’t exist.
 
 
In 2021, in the US an astonishing 66% of Southern Republicans and 50% of independents were in favor of secession. The West Coast also showed strong support for secession but of a different political flavor, this time being mostly supported by Democrats.

Friday, June 28, 2024

July 4th Bullish Pre-Holiday Trade, Bearish After | Jeff Hirsch

Trading the three days ahead of the July 4th Independence Day holiday has historically been stronger than the days after the holiday. Trading on the day before and after the holiday is often lackluster. Volume tends to decline on either side of the holiday as vacations begin early and/or finish late. Since 1980, DJIA, S&P 500, NASDAQ and Russell 2000 have recorded net losses on the day after.


This has become more pronounced in recent years and was the case again last year. However, over the past thirteen years since 2011, trading after Independence Day has softened notably. DJIA has declined ten times in 13 years on the day after. S&P 500 has slipped eight times. Average performance remains fractionally positive. NASDAQ and Russell 2000 have more up days after the 4th but R2K averages losses the two days after the 4th.


Jul
y Best S&P & NASDAQ Month Last 21 Years - nearly all gains in first 13 trading days | Jeff Hirsch
 

A Remake of Beavis and Butt-Head | Alexander Dugin

American democracy is like an episode of Beavis and Butt-Head. In the 1990s, the animated cartoon 'Beavis and Butt-Head' directed by Mike Judge was popular in the United States and Russia. Its heroes were two mentally retarded American teenagers, swearing profanely at each other, expressing one absurd thought after another, unable to solve any domestic situation, but despite their complete uselessness and senselessness, somehow coping with life.   
 
 » The USA is a crazy teenager with a loaded rifle. «

Whenever a series of idiotic actions brought them to the brink of total disaster, an equally ridiculous accident or a breakdown in the logic of things saved them, giving them another chance. Which they immediately squandered, however. And everything repeated in a circle. Failure after failure, eating worms, completely wrong decisions, breaking all possible logical connections, and in the end watching a heavy metal video in which horned men with guitars stage-managed to eat women or live goats.  
 
What the world saw during the election debate between Trump and Biden was just a fresh episode of Beavis and Butt-Head. And both of them somehow look as if they were drawn from cartoon characters: Trump is a remake of Beavis, Biden is a remake of Butt-Head. Trump even has the exact same hairstyle. And the content of the debate is completely in the spirit of the show. Trump seems an order of magnitude more sane than Biden. Even his most ardent opponents have recognised this. It is telling that this time the Democrats did not flood the media with victory speeches about Joe's crushing victory over the despicable fringe fascist. 
 

Trump dealt a blow to the Kiev Nazi junta: he directly called Zelensky a thief and a crook and confirmed that Ukraine has already lost and that the Russians are about to conquer it.
The only thing left to do wrong is to put Trump on the Ukrainian terrorist website 'Myrotvorets' and start writing songs about how he is an agent of Mordor. This is a crucial moment in the war. It is very important to analyze the further development of the election campaign in the USA. Joe is back in hospital and the Democrats will now do something about it. In essence, Trump in this debate won the election before it began. This much is clear for all to see. Now, anything can be expected. 
 

[...] If such a society and such a culture, such candidates and such voters determine the fate of humanity, then we have to admit that we are finished. It is impossible to think of treating or applying developmental techniques to a clinically ill teenager if he has a nuclear button in his hands. We say that Russia is ruled by God, because otherwise its existence is inexplicable. America has some mystery as well. How is it possible to become the most important world power on such grounds, with such people and with such mental problems? It means that it is ruled by someone more serious and invisible. And it doesn't look like God. Rather, someone else.


» All red lines were breached. The time of proxy wars is over. We are prepared for a world war.
Russia will provide all the enemies of the West with everything they need, including nuclear weapons. « 
Alexander Dugin on the escalation of the US and Russia towards totally uncontrolled World War III
and on Donald Trump as the potential savior of humankind
.

Wednesday, June 26, 2024

2-Bar Narrow Range Setup | Toby Crabel

2-Bar Narrow Range (2BNRrepresents a condensation of the market concept called congestion or contraction. Contraction is subsumed within the market Principle of Contraction/Expansion which states that the market, having a specific nature, is constantly changing from a period of movement to a period of rest and back to a period of movement. This interchange between the phases of motion and rest are constantly taking place with one phase directly responsible for the other's existence. 2-Bar NR represents this market principle and provides a means of quantifying contraction in any market environment. This is possible because of the open-ended nature of the concept 2-Bar NR. 
 
 2-Bar Narrow Range (2BNR) in the S&P 500 on June 26, 2024.
If the 2-bar range is the narrowest range from high to low of any two day period relative to
any two day period within the previous twenty days, we are sitting on a 2BNR trading setup for June 27.

Because it is not dependent on a constant measurement it represents contraction in a volatile or narrow market period. In other words, contraction is a relative condition that can occur even in a volatile market. Once a market concept is formulated it is tradable. An ORB (Opening Range Breakout) trade is taken the day after the 2-Bar NR formed. An ORB trade is entered at a predetermined amount above or below the opening range (stretch), that is the range of prices that occur in the first 30 seconds to 5, 15 or 30 minutes of trading. 
 
The assumptions are that with a contraction of this type trending action would follow the direction of the breakout, and that because this pattern exhibits a more defined contraction that trending would take place over the next several days also. It is advantageous if the 2-Bar NR is holding at an important angle of support/resistance, including trendlines, when it is formed. Once the market has moved away from the open in one direction after a 2-Bar NR, it should not return to the opening price. If it were to do so, that would disqualify the day as a trend day. Trending action is ideal and is expected after the pattern.
 
Reference:

S&P 500 — Yearly, Quarterly and Monthly Floor Trader Pivots Levels

S&P 500 — Monthly Bars  — Yearly (2024) Pivots Levels:
R2  5,453  —  R1  5,110  —  MR1 4,781
Yearly Pivot Point (YPP)  4,551
MS1  4,280
  —  S1  4,108  —  S2  3,449

 S&P 500 — Weekly Bars  — Quarterly (Q2 2024) Pivots Levels:
R2  5,662  —  R1  5,546  —  MR1  5,258
Quarterly Pivot Point (QPP)  5,059
MS1  4,956
  —  S1  4,853  —  S2  4,456
 
 S&P 500 — Daily Bars  — Quarterly (Q2) and Monthly (June) Pivots Levels:
R2  5,558  —  MR2  5,490  — R1  5,423  —  MR1  5,319
Monthly Pivot Point  (PP) 5,215
MS1  5,147  —  S1  5,080  —  MS2  4,976  —  S2  4,872
 

Ref
erence:
 

Are We Due For A Little Mean Reversion? | Jeff Hirsch

I remain bullish on 2024. My 2024 Annual Forecast released on December 21, 2023 is on track, yet the market has already achieved (and slightly surpassed) my Base Case Scenario of average election year gains of 8-15%. While my Best Case Scenario of 15-25% is likely now in play with the market running well above any of the historical seasonal patterns I can concoct, the market may be due for a little reversion to the mean.


The charts here illustrate the three most relevant seasonal patterns: All Election Years, election years with a Sitting President Running for reelection and my STA Aggregate Cycle, which is a combo of all years, election years and the 4th year of the decade (years ending in 4). The Midyear Rally I discussed early this week is still in play. But after that around mid-July, I would not be surprised if the market were to pull back toward the mean a bit, maybe 5-8%.

There is plenty on the near-term horizon to spook traders from election campaign and political missteps, to Fedspeak, economic data disappointments and just plain old Summer Doldrums. 

Quoted from:
 
See also:

2024 DJIA Compared to 40-Month and 42-Month Cycles | Sergey Tarassov

Tuesday, June 25, 2024

High in US-Stocks July 3-5 and Small Pullback into July 14-26 | Allen Reminick

Today is June 24th. The market is still very bullish. I am looking for a small pullback starting around July 3rd or July 5th-9th lasting into July 14th-26th. Another rally - possibly to new highs - into late August should follow before a 5 to 10 percent correction into early October and potentially into the US election around November 5th or 6th.


After the election I expect the market going up again at least to the end of 2024 and potentially into May or August of 2025. If the high came in now in July-August, it would be about 5,700; if it comes in next year, it could be way higher than 6,000.

Monday, June 24, 2024

Nasdaq’s Midyear Rally from around June 26 to July 12 | Jeff Hirsch

In the mid-1980s tech’s influence in the market began to grow and the market’s focus in early summer shifted to the outlook for second quarter earnings of technology companies. In anticipation of positive results, over the last three trading days of June and the first nine trading days in July, NASDAQ typically enjoys a rally. 
 

This 12-day run has been up 30 of the past 39 years with an average historical gain of 2.5%. Look for this rally to begin around June 26 and run until about July 12.


After the bursting of the tech bubble in 2000, NASDAQ’s mid-year rally had a spotty track record from 2002 until 2009 with three appearances and five no-shows in those years. However, it has been quite solid over the last fourteen years, up twelve times with two losses. After struggling in the bear market of 2022, NASDAQ resoundingly rebounded last year to gain 4.1% compared to a total July gain of 4.0%.

See also:

Thursday, June 20, 2024

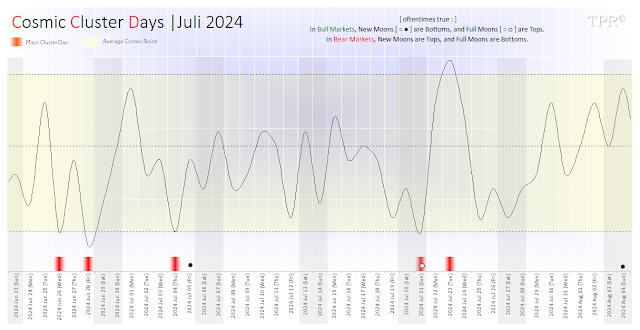
Cosmic Cluster Days | July 2024

 Cosmic Cluster Day  |   Composite Line Cosmic Noise Channel
○ = Full Moon | ● = New Moon

C
osmic Cluster Days and financial markets have no consistent fixed polarity nor directional bias. Nonetheless, swing directions, highs and lows 
— also inside of the 'noise channel'  — may correlate or coincide with financial market directions and reversals. 
 
Upcoming Cluster Days are: 
 
Jun 26 (Wed)
Jun 28 (Fri)
Jul 04 (Thu)
Jul 21 (Sun)
Jul 23 (Tue)
Aug 19 (Mon)
 
Cosmic Cluster Days during May - June 2024 HERE
 
More background information on the original author, the concept and calculation of Cosmic Cluster Days  HERE.
 
Jack Gillen's Sensitive Degrees of the Sun for the NYSE during July 2024:

2024 06 29 (Sat) = SUN @ 8 CAN = 98 degrees = high
July 04 (Thu) = SUN @ 13 CAN = 103 degrees = low
July 07 (Sun) = SUN @ 16 CAN = 106 degrees = high
July 10 (Wed) = SUN @ 18 CAN = 108 degrees = low
July 24 (Wed) = SUN @ 2 LEO = 122 degrees = low
July 29 (Mon) = SUN @ 6 LEO = 126 degrees = high
2024 08 09 (Fri) = SUN @ 17 LEO = 137 degrees = low 

No turning points in the Geocentric Bradley Barometer during July 2024.
 
The SoLunar Rhythm in July 2024.

Tuesday, June 18, 2024

The Taylor Trading Technique | Scott Hoffman

In my opinion, George Douglass Taylor was one of the greatest trading thinkers, and luckily he left behind one book on trading: 'The Taylor Trading Technique' (1950). This book lays out his 'Taylor Book Method' for swing trading in futures. Taylor postulated that the markets had patterns based on "market engineering" from the "powers that be" in the grain markets. These insiders would frequently cause prices to decline to set up a buying opportunity for themselves. Then, after the market rallied sufficiently to yield profit for these insiders, a short-term top was created to give them a selling opportunity. The market would sell off, and the cycle would start again. 
 
George Douglass Taylor was a grain trader in the 1940s and 1950s at the CBOT pit
and is credited original author of the 3 Day Cycle Short-Term Trading System.

The effect of this engineering was to amplify the natural rhythm of the market, creating false moves that would fool traders into buying when they should be selling, and vice versa. The thrust of the Taylor Technique is to identify this rhythm and take advantage of the "false moves". I have long maintained that if an individual could identify moves in the market that would serve to inflict the most pain on unwary traders then they would have a great trading system. I believe the Taylor Technique does that. Taylor created this method for the grain futures markets, but I find it equally applicable in the financial futures markets today. 
 
George Douglass Taylor’s system of short-term swing trading is based on the premise that the market moves in two to three day timeframes, moving from a low to a high and back to a low. The other important concepts are the importance of the previous day’s high and low, the length of upswings relative to downswings, and being a solely technical trader (ignoring fundamentals).

Cycle Day #1 – Buy Day
The first day of the cycle is the buying day. Look for a Buy Day two days after a swing high (the highest high of the past few days). On a Buy Day, look for the market to make its lows first, finding support around yesterday’s low. If the market opens flat to higher, look to buy the first sell off towards the previous low. If the market trades under yesterday’s low, be careful about going home long. The market should close higher than where it opened. If it is making new lows late in the day, it is usually best to exit. You can often get in the next day at a better price.
 
Cycle Day #1 - Buy Day

Generally, it’s good rule of thumb not to buy late in the day on a buy day if the market is heading lower or closing lower than where it opened. Odds favor a lower opening the next day, giving you a better enter price. Likewise, if the market is going to close lower than it opened, don’t be afraid to liquidate your position. Odds are in your favor that you’ll be able to buy at a lower price the next day.

Cycle Day #2 – Sell Day
If you are long and the market is closing in your favor, carry your long position overnight. Odds favor a higher opening the next day setting up the Sell Day, the second day of the cycle. On the Sell Day you should look to sell into strength, liquidating your position, and going home flat. Often, the sell day trades on both sides in what I call a 'fade' day. A fade day often follows a trend day and can be traded from either side.

 Cycle Day #2 - Sell Day

Cycle Day #3 – Sell Short Day
The third day of the cycle is the Sell Short Day. The Sell Short Day is the mirror image of the buying day. On a sell short day, you should be looking to sell early morning resistance, looking for resistance around the previous day’s high. The market should not be making highs late in the day, if it is you should be able to get a better entry point the next day. On a Sell Short Day, the market should close lower than it opened. The Sell Short Day is often followed by a 'Fade' day.
 
Cycle Day #3 - Sell Short Day.

That is the gist of Taylor’s technique - a rhythm of buy-sell-sell short. I don’t always recognize where we are in Taylor’s cycle (you’re always learning!), but on days when it is clear, at the least it gives you a good indication of the market’s bias for that day. In swing trading, the relation of the open to the close should indicate the direction of the next morning’s opening. This helps you determine whether the odds favor being a buyer or a seller on a given day.

Reference:

Monday, June 17, 2024

The Summer Rally | Wayne Whaley

This study looks at the S&P performance from June19 - July23 in those 29 years of the last 40 in which the trailing Quarter, March19 - June19 was positive. As of June 15, the March19 - June19 time frame, with three trading days remaining, is up 4.89% for 2024. The June19 - July23 reaction period will be split into two measures which have distinctly different characteristics, namely June19 - 27 and June27 - July23
 
  • The June 19 - 27 period which is strongly correlated to the June Post Opex week has been negative in this setup in 17 of the last 19 years.
  • The last 14 cases has seen June27 - July23 positive, as well as 25 of the last 29 cases, the so called summer rally time frame you have heard speak of.

June’s Quad Witching Options Expiration – A Volatility Haven │ Jeff Hirsch

The second Quadruple Witching Week of the year brings on some volatile trading with losses frequently exceeding gains. NASDAQ has the weakest record on the first trading day of the week, down 23 times in 42 years. Quad-Witching Friday is usually better, S&P 500 has been up 12 of the last 21 years, but down 6 of the last 8.


Full-week performance is choppy as well, littered with greater than 1% moves in both directions. The week after June’s Quad-Witching Day is horrendous. 
 

This week has experienced DJIA losses in 28 of the last 34 years with an average performance of –0.83%. S&P 500 and NASDAQ have fared better during the week after over the same 34-year span. S&P 500 averaged –0.49%. NASDAQ has averaged +0.03%. Sizable gains in 2021 and 2022 during the week after improved historical average performance notably.

 
NASDAQ 100 (30 m candles)
Friday, June  14 = Buy Day
Monday, June 17 = Sell Day (= sell short positions)
Week # 3/1 in the 3 Week Cycle
XAMD Week (X = Monday Continuation of Friday's direction - A = Tuesday Accumulation 
- M = Wednesday Manipulation Low, Reset for Continuation into Friday High
- D = Thursday Distribution = June 20 Full Moon/Summer Solstice High?)
or Consolidation Midweek (M) Rally?

See also:

The Market Makers Method | Jones Zondo

Price is a reflection of the number of transactions and the price paid for these transactions. A large number of transactions are required in order to shift price. The Forex market is said to trade about $4,000,000,000,000 [four trillion dollars] on average daily. The bulk of transactions are executed by large Warren Buffet institutions, and not by laptop traders such as ourselves.

 » A typical pattern of behavior particularly when analyzing the Three-Day Cycle is to be able
to identify a peak high followed by three moves down and a reversal which will form a peak low
. «

Market Maker ability to dominate the market is overwhelming. It costs roughly 10,000 Lots to move the market by 1 pip, with this in mind Market Makers have the ability to move the price at will and retail traders can’t. For a retail trader to truly succeed in Forex, you need to at least have a concept of this Mammoth process so that you will understand what is happening and why. Rather you adapt to trade with them instead of against them once we are done with the secrets. Once you realize that price is moved as a result of intention, logic decision and the idea that price is a product of emotional feeling (sentiments) of various traders is misguiding BS. Failure to realize this, your trade career will be emotion driven leaving you to react to every trade.

 
See also: