Showing posts with label Chart Patterns. Show all posts

Friday, August 23, 2024

Recent Toby Crabel Price Pattern Setups in the E-mini S&P 500 Futures


Tuesday, July 2, 2024

The Oops! Reversal Setup | Larry Williams

One of Larry Williams’ best-known setups is called Oops!: We are waiting for the market to open. We take as a reference the daily bar of yesterday, with its open, evolution and close. When the market opens, suppose a gap up occurs. A gap up takes place when the open is higher than the highest point that was reached on the previous day; a gap down occurs when the open is lower than the lowest traded point of the previous day.


When a market opens at a very high level and there is a gap up, it is very strong. So, we obviously suppose that it goes up. It will probably do it but, if for some reason it starts to fall and then reaches the highest level of yesterday, it is as if it said: "Oops!, I was wrong. I’m not strong, but weak." In this case, we open a short position at this level. We enter short because we imagine that the market (and the players in the market) realizes it isn’t that strong. Actually, the market is weak, so it will go down. 

To use this setup, we obviously need a stop-loss whose size depends on the market we are trading. How do we close this position? Larry Williams proposed a bailout exit he called "first profitable open". This consists in staying in the position until, on the following day or days, the market opens somewhere below the entry level (because we are short). When that happens, we close the trade. So, we keep the position until we get the profit or, obviously, when we are stopped out. We can also close the position at the end of the same day. The one suggested by Larry Williams is however the best one, although it sounds quite weird. Believe me, the first profitable open is a very effective close of the position.
 
This is the basic version of the Oops! Anyway, I know Larry Williams made some tweaks to it. The Oops! works, but today this specific setup is quite rare. The reason is that many markets trade for 23 hours a day now. So, it’s quite hard to have a heavy gap in just one hour. Maybe, you can have one after the weekend, but normally it’s not there.

Monday, July 1, 2024

Buy & Sell Signals | Larry Williams

 Buy Signal: Dump, dump, (dump), go sideways and pump a bit, one more small dump, then the pump.
Sell Signal: Pump, pump, (pump), go sideways and drop a bit, one more small pump, then the dump.

»  If I've seen prices in a big downtrend, they move sideways, then drop again, but immediately come back up, back into that trading range, that's a buy signal. Why? Because during that trading range, there was accumulation going on. The fact that it broke down fills a lot of long positions. Professional money will buy there, and if it immediately comes back, then that nails it. They've been buying and I want to get long the market.  «

 
See also:

Wednesday, June 26, 2024

2-Bar Narrow Range Setup | Toby Crabel

2-Bar Narrow Range (2BNRrepresents a condensation of the market concept called congestion or contraction. Contraction is subsumed within the market Principle of Contraction/Expansion which states that the market, having a specific nature, is constantly changing from a period of movement to a period of rest and back to a period of movement. This interchange between the phases of motion and rest are constantly taking place with one phase directly responsible for the other's existence. 2-Bar NR represents this market principle and provides a means of quantifying contraction in any market environment. This is possible because of the open-ended nature of the concept 2-Bar NR. 
 
 2-Bar Narrow Range (2BNR) in the S&P 500 on June 26, 2024.
If the 2-bar range is the narrowest range from high to low of any two day period relative to
any two day period within the previous twenty days, we are sitting on a 2BNR trading setup for June 27.

Because it is not dependent on a constant measurement it represents contraction in a volatile or narrow market period. In other words, contraction is a relative condition that can occur even in a volatile market. Once a market concept is formulated it is tradable. An ORB (Opening Range Breakout) trade is taken the day after the 2-Bar NR formed. An ORB trade is entered at a predetermined amount above or below the opening range (stretch), that is the range of prices that occur in the first 30 seconds to 5, 15 or 30 minutes of trading. 
 
The assumptions are that with a contraction of this type trending action would follow the direction of the breakout, and that because this pattern exhibits a more defined contraction that trending would take place over the next several days also. It is advantageous if the 2-Bar NR is holding at an important angle of support/resistance, including trendlines, when it is formed. Once the market has moved away from the open in one direction after a 2-Bar NR, it should not return to the opening price. If it were to do so, that would disqualify the day as a trend day. Trending action is ideal and is expected after the pattern.
 
[Crabel's ORB system doesn't work in today's markets. Different entry criteria need to be applied.]

Reference:

Friday, June 14, 2024

The Principle of Contraction/Expansion | Toby Crabel

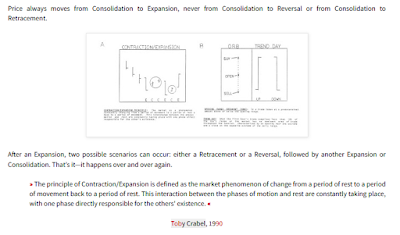
 » The principle of Contraction/Expansion is defined as the market phenomenon of change from a period of rest 
to a period of movement back to a period of rest. This interaction between the phases of motion and rest 
are constantly taking place, with one phase directly responsible for the others' existence. «  
Toby Crabel, 1990
 
In his study 'Day Trading with Short Term Price Patterns and Opening Range Breakout' Toby Crabel defined the following range contraction and expansion patterns:

NR4 - The narrowest daily range relative to the previous three day’s daily ranges compared individually.
NR7 - A day with a daily range that is narrower than the previous six day’s daily ranges compared individually.
WS4 - (Widespread 4) A day with a daily range that is larger than any of the previous three day’s daily ranges.
WS7 - (Widespread 7) A day with a daily range that is larger than any of the previous six day’s daily ranges
             compared individually.

His key findings were: A cumulative total of Gross Profits for the contraction patterns vs expansion patterns on trades in the direction of the move off the open showed $710,000 for contractions on 7,313 trades and $102,000 for expansions on 7,524 trades. Profits were seven times larger for ORB (Opening Range Breakout) trades after contractions than expansions.

» Clearly something is going on here. The suggestion from these results is that one should be looking to go with a forceful move off the open after a contraction and not willing to do so after an expansion. In fact, fading price action off the open, with trend, after an expansion is a consideration. Other patterns can help with the decision on whether to fade a move off the open along with previously mentioned market context. If nothing else, one should be aware of the dangers of ORB trades the day after a big directional day. Caution is necessary after expansions. This is when the most attention is given to the market by the novice trades who invariably get caught in whipsaws and trendless markets. «  

Bitcoin - Inside Bar Narrow Range 4 (ID/NR4)
in monthly, weekly, daily and 4 hour bar charts.

» An object at rest stays at rest and an object in motion stays in motion with the same speed 
and in the same direction unless acted upon by an unbalanced force. «
Isaac Newton's 'First Law of Motion', 1687
 

Monday, May 20, 2024

The 8 Most Common Chart Patterns & How to Trade Them | Aksel Kibar

I've simplified classical chart patterns to the most basic/common 8 patterns. I think most new patterns are derived from those basic ones. Our brains' pattern recognition is not that advanced to focus on so many derivatives. In fact better success can be achieved by narrowing down the below to select few.
 
 
There are 3 Types of Triangles: The symmetrical triangle, the ascending triangle and the descending triangle. Between those three I favor ascending and descending triangles for couple of reasons. One of them is, both ascending and descending triangles have horizontal boundaries. Breakouts through the horizontal boundaries are the chart pattern signal. The other reason is that, both ascending and descending triangles have directional bias due to their upward and downward sloping lower and upper boundaries. I find symmetrical triangles difficult to trade as price usually finds resistance at the minor highs following the breakout. Pause around minor resistance usually hampers the momentum and can result in more frequent failures. A symmetrical triangle has both boundaries converging towards an apex. It is a neutral chart pattern and doesn’t have a directional bias.
 

Type 1 Breakout = Breakout without any Re-Test/Pullback.
Type 2 Breakout = Breakout with a Re-Test/Pullback.
Type 3 Breakout = Breakout followed by hard Re-Test of Pattern Boundary.
Type 4 Breakout = Failed Breakout  - Price fails to continue in the breakout's direction and instead reverses. 


Breakout Type 1, Type 2, and Type 3 Summary.
 
 
 Head & Shoulder Top Failure acting as Bullish Continuation.
 
Cup & Handle
as a Continuation Pattern in an Uptrend.
 
Rectangle as a Continuation Pattern in an Uptrend.

Symmetrical Triangle
as a Continuation Pattern in an Uptrend.
 
Sev
eral Bullish Chart Patterns in an Uptrend.

Rectangle Bullish Reversal.
 
Rectangle Bullish Continuation.
 
The latest stats on pattern reliability: Rectangle continues to lead. With good risk management Type 1 & Type 2 breakouts offered edge with pattern signals.


 From Peter Brandt's foreword to the 2021 Harriman House re-edition of 
Richard Schabacker's 'Technical Analysis and Stock Market Profits'.

Tuesday, December 5, 2023

The Three Day Cycle & Parabolic Trade Setups | Stacey Burke

There are only three things price can do:
1. Breakout from a Range and Trend.
2. Breakout from a Range and Reverse.
3. Trading Range between Highs and Lows
.
 
 1. Structure / Pattern
  •  Do we have any larger geometrical patterns?
  •  Head and Shoulders / Sell (Reverse Head and Shoulders / Buy)
  • Descending Triangle (Sell) Ascending Triangle (Buy)
  • Double Bottoms (Buy), Double Tops (Sell)
  • Rectangles (Continuation / Reversal)
  • Helps us identify geometric patterns for potential measured move profit targets for asymmetrical risk / reward.
I am mainly focused on horizontal ranges no matter what the geometrical pattern is. (The high and the low of the structure, typically this will be numbered “boxes” of 25-50-100 pips.) Numbers are horizontal. I DON’T TRADE DIAGONAL TREND LINE BREAKS.

2. High of the Day (HOD) / Low of the Day (LOD)
 
Where is the high, where is the low? There is a high and a low that the market is trading inside of. The market is either in a consolidation or a break out. The current HOD and LOD may be inside of a larger rectangle.

3. Timings
 
My focus is on the 3 hour window. 1 hour before the equity markets open, the hour of the equity markets open, and the hour after the equity markets open. Hence 12 - 15 minute candles.
  • ASIA 8-11 pm NY EST
  • EUR / LONDON 2-5 am NY EST
  • NEW YORK 8-11 am NY EST
This allows me to have laser-like focus for some simple recurring setups that occur frequently enough for selling, buying or trend trading setups. This repeatable cycle is recurring in all three 12 candle windows. Whether or not the range, the pattern and a good risk / reward trade setup is in each window is unpredictable.

4. Round Numbers
 
Typically these trades will come off of round numbers, specifically 00’s and 50’s. The quarter levels, 25 and 75 will often be a “stop hunt” extension of a 50 or 00 trading box.

5. Price Behaviour for Trade Setups
 
I look for engulfments and pin hammers. These can be “with trend” trades, or reversals, for stop hunts or in a trading range.I look to ENTER the majority of my trades “AT OR NEAR” number, i.e. 25, 50, 75, 00. Sometimes I may limit order these trades, others I may just get filled at market.

• “M” PATTERNS - TYPE 1,2,3
• “W” PATTERNS - TYPE 1,2,3

6. Risk Management / Profit Targets
 
My average STOP LOSS is 1 ATR. For most of the pairs it will be 20 pips. The GBPAUD, GBPNZD may be 25. Depending on the level of volatility on the day, on the pair, it may be a bit more or less give or take. Typically though, I am looking for a 1 bar stop. Position sizing can depend on the type of setup, and the size of stop loss.

The minimum PROFIT TARGET is usually 50 pips. Sometimes a market may hit a previous day’s high or low, or the current day’s high or low, OR SIGNIFICANT ROUND NUMBERS, 00, 50, and the market may stop there. I may only be up 40 pips. When those levels are prominent, it may be necessary to adjust that target on the day, based on HOW PRICE BEHAVES when it gets to those levels. Other trades (Measured Moves) may be in the area of 50-75 or a 100 or more pips. Again, depending on the setup and how that pair is trading on the day.

7. Trade Management / Self Management
 
Once I am in the trade, I will fight every urge that I have to interfere with it. I review the trade setup and thesis that I have for the trade. I monitor the behaviour initially based on my thesis. I will typically leave the screen, or watch, and monitor myself, self talk, do meditation, and possibly review the other pairs to identify any other setups.
 
I will normally NOT ADJUST my stop loss to BREAK EVEN UNTIL, the market has broken a high or low boundary, ( I wait for the 15 min candle to close) OR it has CLOSED 30 pips or more, breaking into the next quarterly range. At 40 pips, depending on if the market has moved (fast or creeping) I will potentially look to LOCK IN 40 pips if the market has “two-sided” trading occurring near my profit target. So, to clarify, if it has spent 30 minutes near my target without hitting it, I will be watching closely to “LOCK IN” profits, in case the market is preparing to reverse. When you are up 40 pips, YOU NEED TO GET PAID.
 
Quoted from:
 
 Dump & Pump Pattern.

 Pump & Dump Pattern.
 
Reference:
 
Stacey Burke - Three Day Trading Setups.
 
Aksel Kibar - Type 1 Breakout: Breakout NOT followed by Pullback.
 
Aksel Kibar - Type 2 Breakout: Breakout followed by Pullback.

Aksel Kibar - Type 3 Breakout: Breakout followed by hard Re-Test of Pattern Boundary.
And then there is the so called 'Failed Breakout' when price fails to continue
moving in the breakout's direction and instead reverses course.

Friday, September 15, 2023

Trend Reversal Entry Strategies

Trend-Reversal Entry Strategies aim to buy at or near the bottom and to sell at or near the top. Advisors and educators often reject these strategies because their technical analysis relies on lagging indicators. However, there are three high probability two-bar reversal patterns: the Reversal Day, the Signal Day and the Snap-Back Reversal Day. These are low-risk trend-reversal entry strategies for short-term trading and swing-trading. The set-ups are identified on the daily chart and the entries executed on the hourly chart or lower timeframes. The profit/loss ration needs to be 1.5 or more. Proper knowledge of market structure and price action is required.
 
How reliable are these 'text book' patterns?
Brent Penfold (2017) - Reversal Patterns.
Oddmund Groette (2023) - Reversal Day Strategy Backtest – Does It Work?

Reversal Day Trade Entry Set-Up
A Reversal Day top forms when price makes a new daily high but the day closes below the prior day's close. The current day's open and the trend to new highs is not sustained by the close. Variations of the Reversal Day are the Key Reversal Day, the Outside Reversal Day and the Outside Key Reversal Day.
 

On a Key Reversal Day the market opens below the prior day's close, makes a new high, but closes below the prior day's close and the current day's open. A Key Reversal Day is a stronger reversal signal than a Reversal Day. Outside Reversal Days and Key Reversal Days are both Outside Days and meet the criteria of the Reversal Day. Outside Reversal Days are stronger reversal indicators than Reversal Days, and Outside Key Reversal Days are even more convincing that a daily reversal has taken place. In all cases the Initial Protective Stop Loss is one tick above the high.

Signal Day Trade Entry Set-Up
A Signal Day opens above the prior day's close, makes a new high and the close is below the current day's open. The open must be in the top 1/3 of the daily range and the close must be in the bottom 1/3 to qualify as a valid Signal Day. Unlike a Reversal Day, the Signal Day's close does not have to be below the prior day's close, only below the current day's open.

The Gap Signal Day is a very strong daily reversal indicator. The entire daily range of the Gap Signal Day is above the prior day's range, leaving a gap at the end of the day. Considering the positive up close as bullish is a misleading view of a Gap Signal Day.
 

In both cases the Initial Protective Stop Loss is one tick above the high of the Signal Day.

Snap-Back Reversal Day Trade Entry Set-Up
This is a two-day reversal setup. On Day One the market makes a new high with an open in the lower 1/3 of the daily range and the high in the lop 1/3. It appears to be a very bullish day. Day Two is the Snap-Back Day with the open in the top 1/3 of the daily range and the close in the bottom 1/3. Day Two does not have to reach new highs or lows compared to Day One. The wider the range of Day One and Day Two, the stronger the indication for a reversal. A stronger Snap-Back Reversal Day has Day Two's open below Day One's close with a new daily low and a close below the prior day's low. 


The Initial Protective Stop Loss is one tick above the higher of the two days.
 
All of the above daily reversal patterns frequently occur within a trend without resulting in a sustained change of trend. Hence daily reversal set-ups are only to be considered valid when time, price and patterns are indicating a termination of the trend. 

Sunday, August 20, 2023

Three-Push Reversal Patterns | Cameron Benson

There are a lot of varying opinions about how the market moves, such as the Wyckoff method, Elliott Waves, Stacey Burke Trading, Steve Mauro’s BTMM, etc. However, one thing that all of these methods and models have in common is that the market moves in three pushes.
 

In all timeframes price is always in some three-push pattern. Price develops in fractals, and everything happening on a higher time frame happens far more frequently on lower time frames. Be aware of Other Time Frame (OTF) traders, of previous monthly, weekly, and daily highs or lows. It helps us to identify liquidity areas. Where are the entry and the stop loss orders? Where is the money, at the upper or at the lower end of a range?
 

After the third push into one direction, price is going into consolidation.
During the second push retail-traders believe that price is going to continue in the same direction, and everybody jumps in. This is the market maker’s trap to harvest entry and stop loss orders during consolidation. The third push is already part of a larger peak formation reversal pattern. 
 
There are four different variations of the three-push pattern that can be observed on all timeframes:             
 
          1.             3 Levels, also referred to as ‘stair stepping’.
            2.             3 Pushes:
                                a.   Stair Step.
                                b.   1, 2, Pause, 3.
                                c.   1, 2, 3.
                                d.   1, Pause, 2, Pause, 3.
                                e.   3 Burst Impulse Candles.
            3.            3 Pushes out of consolidation in any of the above listed variations.
            4.            Working Levels (3 Pushes)
                               a.   Triple Tops.
                               b.   Triple Bottoms.