Friday, October 21, 2022

Global Real Estate Bubble Index 2022 | 18.6 Year Real Estate Cycle

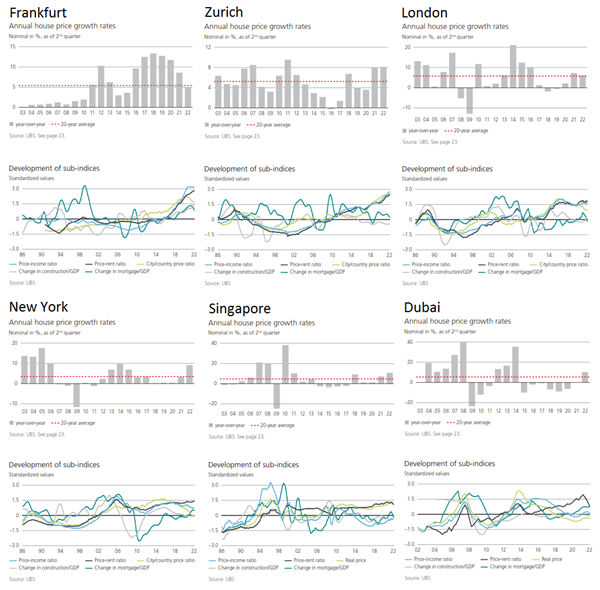
UBS (Oct 11, 2022) - Nominal house price growth in the cities analyzed accelerated to 10% from mid-2021 to mid-2022, representing the highest increase since 2007. Four US cities — Miami, Los Angeles, San Francisco, and Boston — are among the top five with the fastest-growing prices.
 

Imbalances
are sky-high in both analyzed Canadian cities, with Toronto topping the index. Valuations in Frankfurt, Zurich, Munich, and Amsterdam also show elevated risks in Europe. In contrast, there is no bubble risk in the US cities. Since last year, mortgage rates have almost doubled on average across the cities analyzed. Alongside increased prices, this makes city housing much less affordable. A skilled service sector worker can afford roughly one-third less housing space than before the pandemic. 
 
 
In almost all cities, households have been leveraging up. Outstanding mortgages recorded the strongest increase since 2008. Debt-to-GDP is on the rise as well, reflecting the cheap financing conditions and weak economic growth since the pandemic. People have returned to the cities. Strong household formation and unaffordable owner-occupied housing drove demand for rental units. As a result, rents grew by 7% on average last year, making up all rental losses accumulated during the first year of pandemic. Higher interest rates, inflation, turmoil in the financial markets, and deteriorating economic conditions are putting the housing boom under pressure. In a majority of cities with high valuations, price corrections have either already begun, or are expected to start in the coming quarters [...] 

Edward R. Dewey & Edwin F. Dakin, 1947:
"No matter what index be used, this 18-year cycle rhythm seems one of the clearest,
most regular patterns revealed in our economic life.
"
 
In 1947 Edward R. Dewey and Edwin F. Dakin showed that 18.6 year real estate cycles have repeated over centuries: in times of inflation or deflation, whether interest rates are high or low, with or without trade barriers, with government subsidies, and with high, low or no taxes. Fred Harrison demonstrated considerable economic predictive power relating to this 18.6 year cycle pattern: 14 years up, interrupted by a mid-cycle dip, followed by 4 years down. In over two centuries, this cycle has only ever been disrupted by two world wars. The cycle has never been shorter than 17 years, or longer than 21.

Dewey and Dakin wrote: "The building cycle is so long that few people experience two complete cycles in their business life. Education, to be effective, must therefore be “book knowledge” rather than experience […] For many individuals, an unfavorable first experience means a lifetime tragedy […] The welfare of an individual is often determined by the time in which he was born. If he is old enough to start business at the low of a business cycle, which is accompanied by […] rising prices, his chances for success are very good. Conversely, if he is born at such a date that he starts in business at the peak of a building cycle, which is accompanied by falling commodity prices, his chances of success are small. Much of the success or failure of an individual is due to forces over which he has no control; but if he understands these forces, he may protect himself from the worst results of unfavorable combinations and profit personally from favorable combinations."
 
All cycles have the same characteristics, but different influences, and government intervention in markets cannot create or suppress the real estate cycles. Credit, created by banks, through fractional reserve banking, fuels the cycle. Each recession brings new rules and regulations to the banking industry, designed to stop problems and prevent abuses; each upturn brings new ways to profit by exploiting loopholes in those rules and regulations. 
 
Residential real estate is first to recover from a downturn. The mid-cycle slowdown is confusing: The 18-year cycle is so long that few people remember the last one, and when market expansion quickly resumes, people think everything is fine. But the coming downturn will always be much worse than a mid-cycle slowdown. In the final years of a cycle, authorities congratulate themselves on how well they are managing things. If banks know the government will bail them out, why be prudent in lending. Seeing huge returns of others, the masses rush into real estate investing, believing it never goes down until fear overtakes greed. Land values peak about 12-24 months before a recession. 
 
A peak in the building cycle usually follows peak in land values, but precedes the recession. Announcement of the next ‘world’s tallest building’ may well be the most reliable indicator of an approaching peak. Copper prices spike into the last years of each real estate cycle. In the US all recessions since 1960 have been preceded by an inverted yield curve. The turning point in a cycle is often the collapse, or near collapse, of a major bank; some event will arise to cause doubt, but you’ll hear assurances that everything is okay. 
 
The crisis at the end always comes in an environment of rising interest rates, and the stock market is first to trough because of its far greater liquidity. Investors, speculators, and homeowners with little equity at the end of a cycle will always be wiped out. Always. Recovery takes years, not months. Historically, prices have dropped 20-30% from previous peaks. In the US the 18.6 Year Real Estate Cycle is expected to peak and crash again around 2025 - 2026.
 
 
See also:

Thursday, October 20, 2022

Physical Factors of the Historical Process | Alexander Chizhevsky

In 1924 Russian scientist Alexander Chizhevsky advanced a theory claiming that the solar activity cycles affected all of human history. He drew insight from the striking observation that two Russian revolutions of the early XX century (in 1905-07 and 1917) and several major European revolutions of the XIX century (in 1830, 1848, and 1871) occurred in the years of maximum solar activity. 
 

To justify his conviction, Chizhevsky scrutinized the available sunspot records and solar observations comparing them to riots, revolutions, battles and wars in Russia and 71 other countries for the period from 500 B.C. to 1922 A.D. He proposed to divide the eleven-year solar cycle into four phases:

  1. 3-year period of minimum activity (around the solar minimum) characterized by passivity and “autocratic rule”;
  2. 2-year period during which people “begin to organize” under new leaders and “one theme”;
  3. 3-year period (around the solar maximum) of “maximum excitability,” revolutions and wars;
  4. 3-year period of gradual decrease in “excitability,” until people are “apathetic.”
Chizhevsky found that a significant percent of revolutions and what he classified as “the most important historical events” involving “large numbers of people” occurred in the 3-year period around sunspot maximums. Through his further studies, Chizhevsky came to believe that correlations with the solar cycles could be found for a very diverse set of natural phenomena and human activities. In his book, he compiled a list of as many as 27 of them that supposedly fluctuated with the solar cycle, ranging from crop harvests to epidemic diseases to mortality rates. According to his studies, the periods of maximum solar activity were generally associated with negative effects such as lower harvests, intensification of diseases (including psychological ones), and higher mortality rates. However, Subsequent studies generally did not confirm the strength and scope of all the links between solar activity and various physical and social processes claimed by Chizhevsky.

Even as the link between solar activity and revolutions was not as strong as originally claimed by Chizhevsky, it appeared to be able to withstand a statistical test. In 1992 Russian scientist Putilov analyzed large samples of historical events mentioned in the chronology sections of two of the largest Soviet historical encyclopedias (numbering nearly 13,000 events in one book and 4,600 in another). He classified the events into four groups on the dimensions of “tolerance” (e.g., riot-reform) and “polarity” (e.g., civil war-external war). Putilov found that frequency and “polarity” of historical events increased in the year of the maximum of the sunspot cycle and in the next year after it, particularly when compared with the year of the minimum and the year before the minimum. The probability of revolution (the most polar and intolerant of historical events) was the highest during the maximum and the lowest in the year before a minimum of solar activity, with very high statistical significance. The results suggested that solar activity does impact historic events, particularly in the years of sunspot maximums. 
 
In Chizhevsky’s own words (translated):

Alexander Chizhevsky (1922) - The principles of modern natural science have urged me to investigate whether or not there is a correlation between the more important phenomena of nature and events in the social-historical life of mankind. In this direction, beginning in the year 1915, I have performed a number of researches, but at present I am submitting to the public only those which are directed towards determining the connection between the periodical sun-spot activity and (1) the behavior of organized human masses and (2) the universal historical process. The following facts are based upon statistics gathered by me while submitting to a minute scrutiny the history of all the peoples and states known to science, beginning with the V century B. C. and ending with the present day.

1. As soon as the sun-spot activity approaches its maximum, the number of important mass historical events, taken as a whole, increases, approaching its maximum during the sun-spot maximum and decreasing to its minimum during the epochs of the sun-spot minimum.

2. In each century the rise of the synchronic universal military and political activity on the whole of the Earth's territory is observed exactly 9 times. This circumstance enables us to reckon that a cycle of universal human activity embraces 11 years (in the arithmetical mean). The fluctuation's mean curves of the universal historical process on all the surface of the Earth during the period from V century B.C. till XX century A.D. (along the abscissa axis are marked the years, along the ordinate axis – the quantity of important historical events. Dots mark the pretelescopic and later – astronomical data of the sun-spot maximum. Hyphens mark its minimum):
 

Parallelism of the curves of sun-spot activity (below) and the universal human military-political activity (above) from 1749 till 1922:
 

3. Each cycle according to its historical psychological signs is divided into 4 parts (periods):

I. Minimum of excitability: 3 years;
II. Growth of excitability: 2 years;
III. Maximum of excitability: 3 years;
IV. Decline of excitability: 3 years;
 

The number of historical events in each cycle is distributed approximately according to the data for 500 years (XV—XX cent.) in the following manner (in the mean):

I  period: 5%;
II  period: 20%;
III  period: 60%;
IV  period: 15%.

Schematic Summary of Properties of a Complete Historiometric Cycle:


4. The course and development of each lengthy historical event is subject to fluctuations (periods of activity and inactivity) in direct dependence upon the periodical fluctuations occurring in the sun's activity. Formula: the state of predisposition of collective bodies towards action is a function of the sun-spot periodical activity.

5. Episodic leaps or rises in the sun's activity, given the existence in human societies of politico-economical and other exciting factors, are capable of calling forth a synchronic rising in human collective bodies. Formula: the rising of the sun-spot activity transforms the people's potential energy into kinetic energy.

My studies in the sphere of synthesizing historical material have enabled me to determine the following morphological law of the historical process:

6. The course of the universal historical process is composed of an uninterrupted row of cycles, occupying a period equaling in the arithmetical mean 11 years and synchronizing in the degree of its military-political activity with the sun-spot activity. Each cycle possesses the following historio-psychological peculiarities:

a. In the middle points of the cycle's course the mass activity of humanity all over the surface of the Earth, given the presence in human societies of economical, political or military exciting factors, reaches the maximum tension, manifesting itself in psycomotoric pandemics:  revolutions, insurrections, expeditions, migrations etc., creating new formations in the existence of separate states and new historical epochs in the life of humanity. It is accompanied by an integration of the masses, a full expression of their activity and a form of government consisting of a majority.
b. In the extreme points of the cycle's course the tension of the all-human military-political activity falls to the minimum, ceding the way to creative activity and is accompanied by a general decrease of military or political enthusiasm, by peace and peaceful creative work in the sphere of state organizations, international relations, science and art, with a pronounced tendency towards absolutism in the governing powers and a disintegration of the masses.

7. In correlation with the sun-spot maximum stand:

a. The dissemination of different doctrines political, religious etc., the spreading of heresies, religious riots, pilgrimages etc.
b. The appearance of social, military and religious leaders, reformists etc.
c. The formation of political, military, religious and commercial corporations, associations, unions, leagues, sects, companies etc.

8. It is impossible to overlook the fact that pathological epidemics also coincide very frequently with the sun-spot maximum periods.

9. Thus the existence of dependence between the sun-spot activity and the behavior of humanity should be considered established.

One cycle of all-human activity is taken by me for the first measuring unit of the historical process. The science concerned with investigating the historical phenomena from the above point of view I have named historiometria.

At present I am working on a plan of organizing scientific institutes for determining the influence of cosmic and geophysical factors upon the condition of the psychics of individuals and collective bodies, and devising a working method for them.

A. Chizhevsky
November, 1922; 10 Ivanovskaia st., Kaluga, Russia.

Translation:
Sergey Smelyakov (2006) - Chizhevsky's Disclosure: How the Solar Cycles Modulate the History.
 
This article was adopted from:

Wednesday, October 19, 2022

The Heartbeat of the Sun│Valentina V. Zharkova et al.

Valentina V. Zharkova (2016) - We will see it from 2020 to 2053, when the three next cycles will be of a very reduced magnetic field of the sun. Basically, what happens is these two waves, they separate into the opposite hemispheres and they will not be interacting with each other, which means that resulting magnetic field will drop dramatically nearly to zero. And this will be a similar condition like in the Maunder Minimum.
 

What will happen to the Earth remains to be seen and predicted because nobody has developed any program or any models of terrestrial response – they are based on this period when the sun has maximum activity — when the sun has these nice fluctuations, and its magnetic field [is] very strong. But we’re approaching the stage when the magnetic field of the sun is going to be very, very small. 

 
See also:
 

Sunday, October 16, 2022

Panic & Stock Market Crash into End of October ? | Lars von Thienen

Lars von Thienen (Oct 16, 2022) - The coming weeks from October 17 to October 30 will be fascinating. One of the critical time cycles that will come into play next week are the so-called "Dark Days" cycles of past crashes.
 

[...] The chart shows us 4 cyclic patterns now in place surrounding market panics:
  1. The “Dark Days” fall on 21.-22. October next week. Compared to 1929 and even if the markets have already gone down, this has given the index another -30% correction with extremely heavy selling.
  2. The leading movement is synchronized with the Jewish High Holidays: From a leading top in the market (point 1), there is a correction to Rosh Hashanah (2). Rosh Hashanah marks the beginning of the Jewish calendar. From there, a very small rally begins, ending on Yom Kippur (3). Yom Kippur is the emotional climax of the Jewish faith’s high holy days. This cyclical pattern is not well known - but has been seen in all major crashes in the past. See also the alignment in the chart in 1929.
  3. The next cyclical pattern which is seen at financial panics is the so called “Puetz crash window”. According to that pattern, all US crashed had the same important 6-weeks-window signature around a solar eclipse. According to that pattern a panic begins near a full moon that occurs within 6-weeks of a solar eclipse. This year, the solar eclipse occurs on 25. October.
[...] The cyclic configuration we recognize here is unique and does not occur frequently in this bundling.
 

Friday, October 14, 2022

The Name of God & The Rule of Nine | Martin A. Armstrong

Martin A. Armstrong (2008) - Just about everyone knows the "666" omen, but strikingly, most do not know the number of the name the Jews gave to God - "Jehovah." If we use the old Hebrew system we can find the number of God. Yod = 10, He = 5, and Van = 6. Therefore, the name of God in Hebrew He Van He Yod equals 5 + 6 + 5 + 10 = 26. The number of the name assigned to God by the Jews is 26.
 
 
I explained that I discovered the 8.6 year cycle by adding up the total number of financial panics between 1683 and 1907, which created a time-space of 224 years. I found that there were 26 financial panics and then divided that into the 224 years to obtain an average. That produced the 8.6 year frequency. Only when it began to project to specific days, then I decided to study much deeper. There is, the fact that it appeared to be intricately complex running concurrent with countless other cyclical behavior be it natural or man himself in a sort of time-space tube created by an interdependent, self-referral field network whereby, the output of each and every iteration becomes the input for the next generation perpetuating patterns of order in such a dynamic structure, that one cannot see the order of the whole for the mask of superficial chaos. There simply is yet a separate and distinct core frequency of 26 running through the center of the field causing not merely Phase-Transitions, but also Phase-Shifts and Phase-Cancellations when two cycles indeed collide of equal yet opposite forces.

1929 - 1955 - 1981 - 2007

The above sequence of dates provides a simple demonstration of the interesting relationship of 26 to the Economic Confidence Model. The high on the last Private 51.6 year Wave was 1929.75. If we simply take the annual count of 26, we produce the above time series, The great expansion of U.S. debt began from the 1955 post-war target where spending without regard to maintaining the ratio to gold may safely be defined as the start of the perpetual. spending. The next target 1981, was the high of the Public Wave of 51.6 years marked by the peak in interest rates and the open battle against inflation. This brings us to 2007, where the model has correctly given the high 2007.15 that targeted to the day, the start of this economic decline.

Previously, we looked at two time series, one beginning from 1775 marking the start of the American Revolution, contrasted with 1788 that marked the beginning of the federal government with the Constitution. The differential between these two series is half the 26 cycle - 13 years. It is twice 26 that produces the number 52 that we will see is central to the Maya, but was also the observation of the commodity cycle noted by Kondratieff - the Russian economist. We can see that the timing interval of 26 is a critical and interesting number to say the least.
 
Another kabala number of mystery has been attributed to the famous Gaon from Vilna who discovered that the Hebrew
word for truth (taf-mem-aleph) produces the number taf = 400, mem = 40, and aleph = 1 added together 441 = 9.
It was argued that God created the world based upon truth, which is the number 9. If you take any number greater
than 9, add the individual numbers, and subtract the original, we end up with a number divisible by 9.

 
Whether 26 is the "God Cycle" is interesting. Hipparchus of Rhodes observed around 150 BC that the equinoxes moved with time. This is where the Sun's path crosses the celestial equator. He realized that these were not fixed in time and space but traveled in a cyclical manner. The movement was extremely slow in a westerly direction. This amounted to but less than 2° in about 150 years. This slow movement is known as the "Precession of the Equinoxes" and requires generations to even observe. It is less than 2° movement every 150 years, bringing this also to a virtual number of close to 26,000 years to complete one cycle.

Chinese Stock Indices, Gann Time Theory & Solar Terms | Tianbao Zhou et al.

Tianbao Zhou, Xinghao Li & Peng Wang (2021) - Stock indices proved to be rather predictable to some extent. Therefore, according to the study, investors can invest in ETFs that belong to the indices as an ETF is completely coincidental with the index it belongs to. Furthermore, ETFs provide investors with a variety of options of risk and profit. The Shanghai ETF is smooth whereas the Second Board 50 Fund fluctuates a lot. Investors are able to get a high profit from individual stocks as well through implementing the results of this study. The correlation between the turning points of indices and the Chinese 24 solar terms was positive (r = 0.9878).

Turning points always occur near solar terms. Through testing n-day extreme points with a different n value, the sharp turns of the trend often happened near the solar terms, and if we choose 4 days as the valid time radius, the probability is about 80%. Investors should be alert for four days before and four days after a solar term. If the price is too high (low), it is more likely to be affected by the coming solar term, and the higher (lower) the price is, the more instability the trend then would have. However, solar terms are not always strong turning points, but they might cause weaker turning points. In other words, solar terms might not cause a sharp reversal of the stock trend; strong turning points were just some exceptions. Usually, the turning points were not that strong but sufficient for medium-term and short-term investors. The alert period provided investors with a good strategy for short-term and medium-term trading. When judging the upcoming reversal, it should be dynamic. 
 
 
[...] Eight of the Chinese 24 solar terms are very prominent, namely, Chunfen (6), Xiazhi (12), Qiufen (18) and Dongzhi (24), which represent the most vigorous time-points in each season and are the most important four solar terms; the other four are Lichun (3), Lixia (9), Ligiu (15) and Lidong (21). These four represent the beginning of each season and are the second important four solar terms.
 

To our surprise, the importance of these eight solar terms exactly coincides with the wheel of the cycle theory in Gann theory. In Gann’s wheel, the most important four angles are 90°, 180°, 270° and 360° (0°), and the corresponding time-points of each year are exactly the four solar terms of Chunfen (6), Xiazhi (12), Qiufen (18) and Dongzhi (24). The second important four angles, 45°, 135°, 225° and 315° exactly correspond to the four solar terms of Lichun (3), Lixia (9), Liqiu (15) and Lidong (21). Regardless of the angle in Gann theory or solar terms, they all point to a common rule, that is, the stock trend is most likely to turn at these eight points. We can summarize the above results as follows: variable or more significant extreme points often occur at the solar term point, and the solar term point usually makes the stock trend turn according to its strength, and the turning strength is large or small.
 
[...] the Chinese traditional culture, human society is affected by natural factors at every moment, and one of the factors is time (including the time cycle, time-points and time periods). Despite the fact that the absolute price of a stock is generally supposed to be unpredictable, the turning points and reversal of trend of stock indices have rules to follow. 
 
Gann theory suggests that the cycle of time is almost everywhere in the stock market, like our pulse cycle and four seasons of the year. Nobody denies the existence of the time cycle as it retains its rationality and regularity in the nature. Whether or not we know, the regular shocks and vibrations in the stock market caused by time do happen.

[...] we only analyzed the trend and turning points of the Shanghai Index rather than a certain stock or an absolute stock price. We supposed that the index is a wide and general performance of the stock market which eliminates many extreme and irregular cases. Many theories have focused on calendar effects, and all of them show the effort in searching for the independent time factors over regular human factors that may affect the stock market. However, such a division of time is so modern that the turns do not always fall on them. 
 
Besides the solar terms, in China, we have 12 zodiacs (corresponding to a 12-year cycle), lunar months (corresponding to the monthly change of the moon), 10 heavenly stems and 12 earthly branches as well as the constellation of both the Chinese version and the Western version. Thus, we can see that throughout the history, ancient people were always doing tremendous work in summarizing many kinds of time cycles in order to survive, forecast and develop their civilization.
 
 As early as the Spring and Autumn Period (770–476 BC), Chinese ancestors had already established two major solar terms, ri nan zhi (日南至 'Sun South Most') and ri bei zhi (日北至 'Sun North Most'). As of the end of the Warring States Period (475–221 BC), eight key solar terms (Start of Spring, Vernal Equinox, Start of Summer, Summer Solstice, Start of Autumn, Autumnal Equinox, Start of Winter and Winter Solstice) marking the four seasons, were established according to the different positions of the sun and changes in natural phenomena. The rest of the solar terms were initiated in the Western Han Dynasty (206 BC–24 AD). Hence most terms refer to the climate of Xi'an, capital of the Han Dynasty.

[...] The 24 solar terms in each year and their links accurately fitted the trend of the stock in that year. Using 24 price data-points instead of nearly 250 daily data-points of the whole year could make the daily data of high frequency more concise and easier to process. With 250 high-frequency daily data-points, there is strong volatility, which leads to the obvious heteroscedasticity of the data and increases the complexity of data analysis. 
 
The use of 24 solar terms instead of annual data also greatly reduces this unstable and irregular fluctuation. This also coincides with Gann theory. The forecast of future trends in the all-terms group and the eight-terms group was precise, but there remained a gap with the absolute price. We were only able to forecast the time-points and the turning points; as for the absolute price, we hardly made it. This is because the stock market involves a great deal of instability and is extremely complicated.


[...] as we were inspired by Gann, Elliott and the Chinese 24 solar terms, we would rather look for those that do not change, and that is the key to have a better understanding and cognition of our real world, of course, including the stock market. For this reason, it is the higher dimensional time factor and time cycle that produce an overwhelming impact on the stock market, so it reminds us of taking into account the importance of time when conducting such a study. That is why Gann summarized a tremendous amount of time periods to inform the possible reversal in the capital market while the ancient Chinese figured out 24 divisions of a year as 24 solar terms which all solely point to time.

In addition, the ancient Chinese elaborated a complex system, and there are actually many  other divisions of time, years, months, etc. in the Chinese culture. For example, the ten heavenly stems and the twelve earthly branches decide what a year would be like, and that is a 60-year cycle as there are 60 different combinations of one out of the ten heavenly stems with one out of the twelve earthly branches. By the way, one combination is called Gengzi, which is supposed to be the year of disasters and conflicts; the latest Gengzi year was 2020.


Periods When to Make Money | Benner Cycle Projection into 2023 Major Low

Samuel Benner was a prosperous American farmer wiped out financially by the 1873 panic and a hog cholera epidemic. In retirement, he set about to establish the causes and timing of fluctuations in the economy. 
 
Edward R. Dewey (1967):
» If you had used these dates for trading, your percentage gains between 1872 and 1939
would have been 50 times your losses!
«

In 1875 he published a book called
"Benner's prophecies of future ups and downs in prices" forecasting commodity prices for the period 1876 to 1904. Many - not all - of these forecasts were fairly accurate. The Benner Cycle includes:
  • A (upper line): "Years in which Panics have occurred and will occur again." A 54 year cycle alternating every 18, 20 and 16 years.
  • B (middle line): "Years of Good Times, High Prices and the time to sell Stocks and values of all kinds." Cycles alternating every 8, 9 and 10 years.
  • C (lower line): "Years of Hard Times, Low Prices, and a good time to buy Stocks, 'Corner Lots', Goods, etc, and hold till the 'Boom' reaches the years of good times; then unload". A 27 year cycle in pig iron prices with lows every 7, 11, 9 years and peaks in the order 8, 9, 10 years (B - middle line).
Benner's cycle projections align with the latest analysis of the "Foundation for the Study of Cycles" and are pointing to a major stock market low in the US in 2023. David Hickson's Hurst cycle analysis projects this low to March of 2023 and Martin Armstrong to April 11, 2023 (Tue).
 
» Periods When to Make Money « ; the original business card of George Tritch Hardware Co.
Apparently, the diagram was compiled by George Tritch in 1872, but was not attributed to
him by Samuel Benner in 1875.
 
References: