Showing posts with label ICT. Show all posts

Saturday, March 1, 2025

Market Logic is Based on Liquidity, Volume, and Inefficiency | orderbloque

There are three main tools for market analysis that you will need once and for all. No more patterns and unnecessary clutter that only hinder and bring failures. The logic of the market is very simple and based on just three main elements: Liquidity, Volume, and Inefficiency. All price action can be described using just these three concepts. 
 
 » The logic of the market is based on liquidity, volume, and inefficiency. «

Liquidity: At the top of this chain is liquidity, the primary driver of the market. Without liquidity—without buy or sell orders—the market would come to a standstill. It's crucial to understand that while any element on the chart can provide liquidity, the key factor is the quantity: volume.
Volume: The second most important element is volumethe foundation of all our market logic and strategy. Volume directly reflects the amount of liquidity, or money, that has entered the market.
Inefficency: The third element is inefficiency, which arises from the influence of volume on price. Inefficiencies are graphical representations of volume at a specific moment in time, varying by time frame, and serve as tools for analyzing the chart.
 
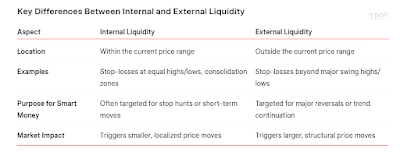
Price always moves from liquidity to inefficiency and vice versa, or from internal liquidity to external liquidity and vice versa. Hence, when looking at any chart, the Points of Interest (POIs) are always price levels or zones where liquidity rests in the form of stop orders, unfilled, and partially filled orders, namely Fair Value Gaps (FVGs), Order Blocks, Rejection Blocks, Support & Resistance at previous highs and lows, or Fractal Points. 
 

All these concepts and terms are briefly defined and outlined below, and explained in detail with context and chart examples in the following video.

How Fair Value Gaps (FVGs), Order Blocks (OB), and Rejection Blocks (RB) operate.
 
Balanced and Unbalanced State of the Market
To understand the deeper logic of inefficiencies and market movements, we need to consider two main factors. The first factor is the state of the market at a certain point in time: balanced or unbalanced. What does this mean? 
 
 
When the market is in a balanced state, the volume of buys and sells is equivalent, and price hardly moves, with neither buyers nor sellers dominating the market. This is very rare and usually occurs on days with very low volatility. The second type is the unbalanced state, which is more typical of any market. This occurs when buy volume exceeds sell volume, causing price to rise, or when sell volume exceeds buy volume, causing price to fall.
 
Efficient and Inefficient Price Delivery
The second factor is the efficiency of price delivery, which also comes in two types. The first type is efficient delivery, where, in the context of a certain market movement, both buyers and sellers are present, allowing for a more even exchange of assets. 

 Efficient Price Delivery and Inefficient Price Delivery.

It is important to note that price delivery is always an unbalanced process in which one side—either buyers or sellers—dominates. 
 
The second type is inefficient price delivery, which occurs when the exchange of assets is uneven in certain price ranges between buyers and sellers. This means that there are areas in the market where orders remain unexecuted or are only partially filled, which is a key sign of inefficient pricing. Inefficient price delivery causes a Fair Value Gap (FVG). 
 
Fair Value Gaps (FVGs)
A Fair Value Gap (FVG) is a formation consisting of three candles where the shadows or wicks of the first and third candles do not overlap each other in both bullish and bearish variants, indicating an imbalance in buying or selling pressure.
 
 A Fair Value Gap (FVG) is a 3 candle pattern where the shadows 
of the first and third candles do not overlap, indicating an imbalance.
 
 A FVG has three levels: the upper and lower boundaries, and the 0.5 level, 
where, ideally, price action should revisit and bounce off, making it a potential entry point for a position.

Regarding the validity of the FVG when it is tested, it’s quite complex because much depends on timing. However, the key point is that price should not close below the lower boundary when the FVG is bullish and should not close above the upper boundary when the FVG is bearish. A close above the upper boundary in a bearish FVG or below the lower boundary in a bullish FVG would be considered an inverted fair value gap, which may signal a continuation of the movement. Everything else is permissible, but much depends on the context. 
 
 Examples of bearish and bullish FVGs.
 
Support and Resistance (SnR)
Support occurs when two candles form on the chart. The level where the bearish candle closes and the bullish candle opens is called Support. This is where buyers show activity and prevent the price from falling lower (Sell and Buy Candles).


Resistance occurs when two candles form on the chart. The level where the bullish candle closes and the bearish candle opens is called Resistance. This is where sellers show activity and prevent the price from rising higher (Buy and Sell Candles).

Order Block (OB)
A Bullish Order Block is a price movement where the Resistance level was broken with subsequent confirmation by the candle body closing above it.
 

A Bearish Order Block is a price movement where the Support level was broken with subsequent confirmation by the candle body closing below it.
 
Rejection Block (RB)
A Rejection Block is a two-candle formation where the range of shadows forms a zone of interest, and it doesn't matter which one is longer or shorter. 
 

In the bullish variant, it begins at the Support level. In the bearish variant, it begins at the Resistance level. 

Fractal Point (FP)
A Fractal Low (FL) is a three-candle formation where the minimum of the middle candle is lower than the minimums of the first and third candles. Five-candle fractals are considered potentially stronger.


A Fractal High (FH) is the opposite three-candle formation, where the middle candle has the highest maximum compared to the adjacent candles.
 
Dealing Range (DR)
The Dealing Range is a price movement that can be identified using two opposing fractal points (High and Low), regardless of direction. This formation displays the balance between buyers and sellers during a specific time period and helps to more clearly define potential zones of interest.


The Dealing Range is divided into two main zones - Premium and Discount with an Equilibrium level in the middle.
 
High Resistance Logic
High Resistance is considered a movement that has interacted with liquidity (Fractal Raid) or inefficiency (FVG rebalance) usually on the same timeframe, resulting in the formation of (OB, RB, FVG), plus a fractal point has formed as a level confirming the extreme. 


Thursday, July 18, 2024

Interbank Price Delivery Algorithm (IPDA) Data Ranges | D'onte Goodridge

IPTA stands for Interbank Price Delivery Algorithm which controls the price action on our charts. It is the sole reason we get the four phases of the market: consolidation, expansion, retracement, and reversal. IPTA is used by Commercial Speculators to move large orders in the market. IPTA creates shifts on the daily chart every 20, 40, and 60 trading days, known as the IPDA look-back periods.
 
 IPDA Look-Back Periods = 20, 40, and 60 Trading Days

Approximately every 20 trading days, new liquidity pools form on both sides of the market. Understanding IPTA will give clarity about which levels are significant to current price. IPTA is always working and exchanging orders every second. IPTA can be applied on a daily timeframe of the current trading day or the first trading day of a month. 
 
Before trading a new month, traders should follow three steps to gain insight in the market:

(I.) Visualize IPDA Data Ranges in Daily Chart
The first step you must follow is finding the first trading day of a new month. Next you count back 20, 40, and 60 trading days (TD) from the first trading day of the month. Last find the highest high and lowest low in each look back data range.

 
The above is the daily chart of British pound versus US dollar (GBPUSD). Currently we are in January 2023, and the first official trading day is Monday, January 2, 2023. That is the start. From here we look back 20, 40, and 60 trading days: back 20 TD = December 2, 2022; back 40 TD = November 4, 2022; back 60 TD = October 7, 2022. Now we have all our look back data ranges. We find the highest high (red lines) and lowest low (blue lines) in al three quadrants.

(II.) Create hypothesis were price might draw to based on Technical and Fundamental Analysis
Now that we have finished our chart activity, we will take a look at technical analysis, then perform fundamental analysis and gain macroeconomic data that can aid with insight. Last, bring together the two analysis techniques to form a hypothesis on what price should do in the near future. 
 
Every new trading month, I am asking myself two questions: 
 
(1.) Is price going to give me a quarterly shift, meaning change trends?
(2.) Or is price going to continue its current trend? 
 
I have no idea whether or not the market is going to continue its trend or make a quarterly shift during the new month. However, using the IPTA ranges, I am able to structure some story-line, especially around liquidity. Going into a new trading month, IPTA ranges can help to figure out where the large orders of liquidity are residing. One side of the market is going to be taken, whether that is buy side liquidity or sell side liquidity. Look for the highs and lows that are still intact. This is where the price algorithm is going to draw to.
 
(III.) Consider Seasonality
Incorporate Seasonality for more insight going into a new trading month. Seasonality does not tell you when to buy or sell for the year but it does give a general sense of when to anticipate the high of the year or the low of the year or when a instrument may be going sideways for a month or a couple of months.

 
IPDA Library Example #1: Gold/USD vs IPDA.
 Primary driver of the market are Interest Rate Differentials (IRDs).
 
Ref
erence:

Sunday, July 14, 2024

Trading Major News Events | D'onte Goodridge

News events typically inject momentum into the market, often prompting traders to anticipate where price might trend in response to the news. Making educated predictions about these movements is a common strategy rooted in technical analysis. Position yourself AFTER major news releases (NFP, CPI, PPI, PMI, FOMC etc.) with either a Pump & Dump or a Dump & Pump trading setup.


Sell Scenario/Setup: Wait for the buy side liquidity pool on the 15 minute timeframe to be raided first. After that, go to the 1 minute timeframe entry above the killzone's opening price. Then, anticipate that price will revert back down to a sell side liquidity level.
 
 
Buy Scenario/Setup: Wait for the sell side liquidity pool on the 15 minute timeframe to be raided first. After that, go to the 1 minute timeframe entry below the killzone's opening price. Then, anticipate that price will revert back up to a buy side liquidity level.
 
When price moves above the opening price of a killzone, it's in a premium. This is where to find ideal sell entries. 


When price moves below the opening price of a killzone, it's in a
discount. This is where to find ideal buy entries.

Friday, July 12, 2024

ICT Time Macros & Quarterly Theory | Michael J. Huddleston & Jevaunie Daye

Algorithmic macros are timed directives for market maker price algorithms to seek and take out liquidity levels and imbalances in the market. Hence looking at a chart the first task is always to identify imbalances/inefficiencies, buy-side and sell-side liquidity levels. Look at previous day's highs and lows, session highs and lows, highs and lows in the last three days and the previous week. 
 
 
There are 8 macros during the trading day:
 
          #1  London Pre-Open Macro      02:33 - 03:00 EST/EDT
#2 London Open Macro               04:03 - 04:30
#3 New York AM Macro                 08:50 - 09:10
#
4 London Close Macro               09:50 - 10:10
#
5 London Fix Macro                    10:50 - 11:10
#
6 New York AM Close Macro    11:50 - 12:10
#
7 New York Lunch Macro          13:10 - 13:40
#
8 New York PM Close Macro    15:15 - 15:45
 
ICT Killzones and Macros in the US Dollar Index 5 minute chart.
 
ICT Killzones and Macros in the S&P 500 E-mini Futures 5 minute chart.

Macros focus mainly on the first 20, 30, or 40 minutes of a trading hour (
22.5 Minute Cycle)
 
There are no ICT macros during the Asian Session.  
The macro between 9:50 and 10:10 is a time window where the market maker algorithm starts running for liquidity (look for ICT Silver Bullet setup).
The period between 10:50 and 11:10 marks the end of the 3rd hour of the New York AM Session, and the first 90 minutes of floor trading (90 Minute Cycle). 
The transition from the AM session to the lunch period leads either to consolidation, reversal or continuation (6 Hour AMDX/XAMD Cycle).
 
Divison of the trading day according to the Quarterly Theory:
6 Hour Sessions, 90 Minute Quarters & 22.5 Minute Micro Cycles/Quarters (EST/EDT).
 
6 Hour Sessions & 90 Minute Quarters in the S&P 500 E-mini Futures 15 minute chart.
 
90 minute Cycles & 22.5 Minute Micro Quarters in the S&P 500 E-mini Futures 1 minute chart.
 
Based on market structure and price action prior and during a macro, three categories can be classified:
 
(1.) Manipulation Macros sweep both buy-side and sell-side liquidity levels.
(2.) Expansion Macros sweep liquidity only on the buy-side OR the sell-side (trending price).
(3.) Accumulation Macros are characterized by ranging prices. 
 
Swing highs and lows of macro intervals can act as support and resistance.
 
Reference:

Thursday, July 4, 2024

Structural Characteristics of Bullish and Bearish Months | D'onte Goodridge

Traders want to find trending markets but often fail to see and understand the structural characteristics of bullish and bearish months. Both move in a similar fashion but inverse to one another. Here are the characteristics for the formation of a bullish month:
 
 
The first example is a daily chart of US Dollar versus Japanese Yen (USDJPY) during February 2023. The market was trending up. It was a bullish month. Let's identify the five key factors to a bullish month:

1. Price moves below the monthly opening price.
2. A swing low forms below the month's open.
3. Price purges a previous daily low (PDL) and reverses back to a previous daily high (PDH).
4. The market creates a market structure shift (MSS) to the upside and an Imbalance or Fair Value Gap (FVG).
5. Higher swing highs and higher swing lows form.
 

Looking at the daily candles in the USDJPY chart, we see the methodical sequence of a Bullish Month developing:
 
1. Price was movesg below the monthly opening price. Price stops below it, runs up, drops below it, runs up and continues the bullish trend.
2. A swing low below the month's open forms. This is a swing low because the candle on the left has a higher low and the candle on the right has a higher low, hence the low in the middle is the lowest point. To form a swing low  only takes three bars.
3. Price purges a previous low and works back to a previous high. The following day price reverses back to the previous daily high, all happening within a three bar setup, creating a swing low, which is a purge on the previous daily low and a reversal back to a previous daily high.
4. Next the market creates a shift to the upside with speed through a previous swing high and a FVG.
5. And price created a new swing high and a higher swing low.

The next example is a daily chart of Apple during January 2023. The same five criteria for a Bullish Month were met:
 

Now let's look at the five key factors to a Bearish Month:

1. Price moves above the monthly opening price.
2. A swing high forms above the month's open.
3. Price purges a previous daily high and reverses back to a previous daily low.
4. The market creates a shift to the downside and a FVG.
5. Lower swing highs and lower swing lows form.
 

The first example is a daily chart of British Pound versus US Dollar during August 2022. The market was trending down. Identify the above listed five criteria for the formation of a Bearish Month:
 
 
The last example is a daily chart of Gold during February 2023. Gold was in a down trend. Identify the structural criteria for the formation of a Bearish Month:


Monday, July 1, 2024

Buy and Sell Signals | Larry Williams

If I observe prices in a strong downtrend, followed by a period of sideways movement before another decline, only to immediately return to the previous trading range, that's a buy signal.
 

Buy Signal: Dump, dump, (dump), go sideways and pump a bit, one more small dump, then the pump.
Sell Signal: Pump, pump, (pump), go sideways and drop a bit, one more small pump, then the dump.
 
Why? Because, during the sideways range, accumulation was taking place. The breakdown likely liquidated many long positions, and professional money will often buy in that area.
 
 
If the price quickly returns to the range, it confirms that they’ve been buying, and that's when I want to enter a long position in the market.
 
See also: