Showing posts with label Volatility. Show all posts

Friday, July 25, 2025

August 2025 Post-Election Year Seasonality of US Stock Indexes | Jeff Hirsch

August was the best DJIA month from 1901–1951, driven by agriculture and farming. Since 1988, however, it has become the worst month for DJIA and Russell 2000, and the second worst for S&P 500, NASDAQ, and Russell 1000, with average returns from +0.1% (NASDAQ) to –0.8% (DJIA). In August 2022, all major indexes fell over 4%; in 2023, losses exceeded 1.8%.
 
Down from August 4 (Mon) into August 19 (Tue), mid- to late-month sideways to down, up into month end.

Since 1950, in post-election years (dashed lines in chart above), August typically starts strong with average gains in the first two trading days, then declines until shortly after mid-month. A rebound of varying size and length usually follows, before major indexes end the month in choppy or sideways trading.
 

The S&P 500 rises steadily through July (blue STA Aggregate Cycle), 
peaks in early August, and pulls back into late August.
 
In post-election years, August has been even weaker: it’s the worst month for DJIA and Russell 1000, second worst for S&P 500, NASDAQ, and Russell 2000. Average losses range from –0.5% (Russell 2000) to –1.5% (DJIA), with more down Augusts than up across all indexes.
  
Reference:
 
 
Bank of America (BoA) analyst Paul Ciana highlights a historical S&P 500 trend since 1928, where the average trend tended to be frontloaded in July, peaking by the end of August and correcting lower in September. However, since 2015 a similar pattern with a mid-August peak developed while the median trend sees a late September peak.


The summer doldrums (late June to early September) typically see 20-40% lower trading volumes and variable volatility due to reduced market participation. Equities, bonds, commodities, and forex show subdued activity, with occasional volatility spikes due to low liquidity, and, in August 2025, possibly from more US tariffs craze and geopolitical events. 
 
  
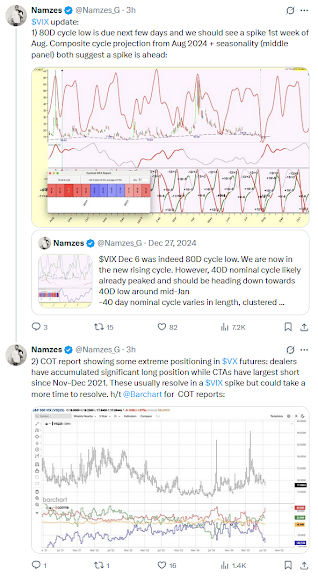
The latest Commitment of Traders (COT) report (see above) reveals extreme positioning in VIX futures, with dealers (= banks, broker-dealers, intermediaries managing risk from client trades, not speculating) holding substantial long positions and CTAs (= hedge funds, who are on the other side of the trade, typically as speculators) showing their largest short exposure since November–December 2021—a pattern that has frequently preceded spikes in the VIX. This unusual market setup suggests potential volatility in early August 2025 and aligns with Namze's forecast of an 80-day cycle low in the VIX during that period. However, the resolution may be delayed due to the scale of the positioning. 


According to BofA Global Research, the average US Presidential Cycle Year 1
(1928-2024) peaks in July and falls around 8% by year-end.
 
A seasonal cycle analysis by Ned Davis Research on the 2025 S&P 500 composite—blending the standard seasonal, 4-year Presidential, and 10-year decennial cycles—projects a current peak, choppy action through October, a late-year drawdown,
and a strong Q4 rally. August and September appear as potential weak spots.

 Bitcoin Seasonal Pattern 2018-2024 vs 2025.
 
See also:

Thursday, July 17, 2025

ICT Intraday Liquidity & Volatility Trading Playbook │ JadeCap

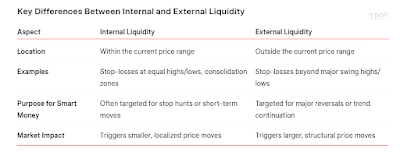
This strategy focuses on how price reacts to liquidity and volatility during the trading day. Liquidity refers to the areas on a chart where other traders have placed stop-loss orders, usually just above recent highs or just below recent lows. The market often moves into these areas to trigger those stops, and then either reverses sharply or continues strongly in the same direction.

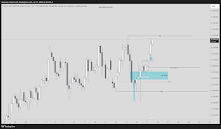
Trade Example - NQ Short (1-H Chart)
 
The goal of this strategy is to spot those liquidity grabs, wait for a clear reaction, and then enter with confidence—either to trade the reversal or the continuation. The method is built for traders who prefer to focus on one trading day at a time, using clear logic, session structure, and precise timing.
 
On this episode of Chart Fanatics we are joined by Kyle Ng (AKA Jadecap). Regarded as ICT's best student and recently achieved a world record payout with Apex. Kyle reveals his complete ICT playbook that allowed him to generate millions from the markets. In this episode you'll learn how to manage open exposure and lock in profits, how to predict the next daily candle and the psychology behind avoiding greed in a trade. Riz Iqbal, May 15, 2025.

Each trade begins with a daily bias: a simple outlook on whether price is likely to move up or down today. Then the trader watches for session liquidity raids (like the Asian or London session highs/lows being taken out), and enters only after confirmation appears through a fair value gap, market structure shift, or divergence between markets. This model works well for intraday trades but can also be used for swing trades when the higher time frame aligns with the setup.

To take a trade using this model, the following must be true:

Clear Daily Bias: Decide if you’re bullish or bearish for the day using the daily chart.
Consider recent highs, lows, inefficiencies, and where the price is likely to go next.
Session Liquidity Zones Marked: These are common stop zones and entry traps:
Previous Day’s High and Low
Asian Session High/Low
London Session High/Low
Wait for a Liquidity Raid: A key session level must be taken out during the New York session — this is your signal
that stop orders have been hit and a potential move is beginning.
Confirmation on Lower Time Frame (15m / 5m). After the liquidity raid, wait for one of these confirmations:
Fair Value Gap (FVG)
Market Structure Shift (MSS)
Turtle Soup (false breakout and reversal)
Breaker Block
Ideal Time Window
Trade setups should form between 9:30 and 11:30 AM EST/EDT.
 
Key Differences Between Internal and External Liquidity.

Target & ExitYour target depends on the setup type. Intraday Targets: Opposite session liquidity, fair value gaps, or  equal highs/
lows. If the trade slows near midday, consider exiting  even before the full target is reached.
Swing Targets: Use higher time frame liquidity zones (daily/weekly highs or lows), imbalances, or major structure. 
Swing trades can be held for multiple days as long as the bias and structure support it. Use time-of-day awareness, price behavior, and your risk profile to decide whether to hold or exit early.

Pros & Cons of the Strategy
This model is designed to deliver high quality, repeatable setups — but like any trading method, there are key things to understand before using it. Note: The cons listed here aren’t disadvantages. They are things to be aware of — important characteristics that require patience, discipline, and proper management to make the model work effectively.
 

Trade Example - NQ Short (15-Min Chart)

Reference:
ooooOoooo
 
If markets continually trend higher, any run on short-term highs should only be seen as short term liquidity being taken. Any retracement lower should be framed as a return to internal range liquidity prior to continuation.This keeps you on the RIGHT side of the market and you stop anticipating major reversals. Never try to pick tops and bottoms. Leave that to the big boys. We only want to ride their coattails. JadeCap's Trading Room, July 16, 2025.
 
Looking for Tuesdays highs on ES. JadeCap's Trading Room, July 17, 2025, 9:03.
 
I stopped adding new concepts and tools and just focused on properly executing what I've already learned. A few lines, context, and ironclad risk management. Stop focusing on the P&L and the size of your trades. If you can trade 1 micro you can trade 10 minis. But you can't do that at scale without a solid PROCESS. JadeCap's Trading Room, July 17, 2025, 14:47

Saturday, July 5, 2025

The NAAIM Index vs the S&P 500 | Branimir Vojcic

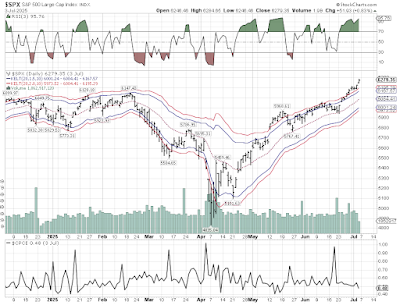
The NAAIM (National Association of Active Investment Managers) Index is at about a level which in the past resulted in corrections.
 
 
The NAAIM Exposure Index, compiled by the National Association of Active Investment Managers, measures the average equity exposure of its member firms, reflecting their sentiment toward US equity markets. It ranges from -200% (fully leveraged short) to +200% (fully leveraged long), with 0% indicating a neutral stance (cash or hedged). As a contrarian indicator for swing trading, it’s often used to gauge market sentiment extremes, with the assumption that overly bullish or bearish positioning by active managers signals potential market reversals. 
 
However, its limitations—such as limited predictive power, small sample size, manager variability, and volatility—mean it’s not a standalone solution. While it can enhance market analysis, traders should approach it cautiously, recognizing that other indicators like the VIX may offer stronger contrarian signals for profitable swing trading.


Volatility Index (VIX) closed at 16.38 on July 3, 2025
 
See also:

Sunday, July 14, 2024

Panic Cycles Week July 15 - 19 & Week September 9 - 13 | Martin Armstrong

 
This assassination attempt came precisely at the time our computer had provided. The week of July 15th was showing up when this year began. Look at the volatility and uncertainty ahead into September. Will they try again? 


Saturday, March 18, 2017

Tuesday, February 28, 2017

The “Gone Fishing” Market

Source: Bespoke (Feb 27, 2017)
The latest example of zero volatility in the market comes courtesy of the S&P 500’s intraday trading range. Over the last 50 sessions, the S&P 500’s average percentage spread between the intraday high and intraday low has been 0.540%. Going back to 1983, when our database of intraday data begins, there has only been one other time where the S&P 500’s 50-day average intraday range was narrower. That was back in early February 1994 when the average range got as low as 0.539%, so the current narrow range is close to a record. But it gets even better.  Barring a big intraday move tomorrow (greater than 1% – an intraday range we haven’t seen since mid-December), the S&P 500’s average daily range will drop below the record low of 0.539% that has been in place for nearly a quarter of a century.

Sunday, May 25, 2014

Update: SP500 and VIX - Intermediate Term Delta Projections

Apparently there was an inversion in the ITD. So in early June a low in the VIX and a high in stocks
should be expected. Source: Time-Price-Research (Tuesday, February 18, 2014)

Updated Delta count for S&P 500: (Friday, May 23, 2014)


Also the LOW in the SoLunar Tides on June 1 points to a HIGH in equities on that date