Showing posts with label Short-Term Trading. Show all posts

Saturday, September 14, 2024

Price Action Patterns & Entries at High and Low of the Day | Cameron Benson

Our focus is on price action trading at key levels: daily high and low, and the previous day's extremes. We examine how price reaches these levels — through Stair-Stepping or Ramping — and its subsequent behavior. The price action patterns include M's, W's, Double Tops/Bottoms, and Pin Hammers at daily highs and lows. 
 
 Stair-Stepping and M Patterns: These indicate potential reversals at daily highs or lows, 
with detailed entries and exits often managed through lower time frames.

Ramping is characterized by parabolic price movements and often leads to swift reversals. Observing tight candle patterns with minimal overlap helps identify strong trends and potential breakouts. We also look for specific patterns like Stair-Stepping and Three Pushes, with Peak Formations signaling possible reversals.

 
 Ramping Behavior: Recognized by tight, parabolic moves followed by rapid reversals. 
The ramp into extremes usually signals significant price shifts.


The following 5 minute charts of the NASDAQ are from last week
(September  9-13, 2024). They show Entry and Exit Strategies, using Pin Hammers and Engulfments for Entries, and managing stops based on price action, with adjustments for larger, more volatile bars.

Monday, September  9 (Day 1 of 3 Day Cycle):
 
 Identified an M pattern at the high of the day with a pin hammer and engulfment, suggesting a strong short entry.

Tuesday, September  10 (Day 2):

 
Despite a promising setup, a large entry bar resulted in a stop-out. 
Emphasis on avoiding large entry bars and managing risk.
 
Wednesday, September 11 (Day 3/1)
 
 Similar to previous days with M patterns and engulfments, also highlighting entry points and risk management.

Thursday (Day 2) and Friday (Day 3), September 12-13:
 
 Charts show patterns like descending triangles and W formations, 
with a focus on understanding price behavior relative to session timings.
 
Successful short-term trading relies on recognizing and acting upon the above presented price action patterns, managing entries and exits based on contextual behavior, and adapting strategies according to the specific market conditions within the 3 Day Cycle.
 

Sunday, September 8, 2024

Toby Crabel’s Bull Hook Trading Strategy Tested | Ali Casey

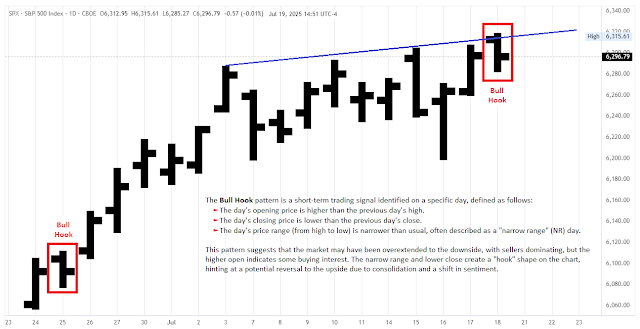
As an algo trader, I value patterns for their ease of programming and testing, which allows for the development of robust trading strategies. Today, we'll explore bull and bear hooks, patterns that can vary in details but generally serve to catch traders on the wrong side. Toby Crabel, Joe Ross, and Thomas Bulkowski, among others, have variations of these patterns.

Toby Crabel's original definition of the Bull Hook pattern:
» A Bull Hook occurs on Day 2. A Bull Hook is defined as a day with a higher open than the 
previous day's high followed by a lower close with a narrowing daily range. The next day (Day 1), 
a trade is taken on the initial move off the open, preferably to the upside. «
 
Toby Crabel's original definition of the Bear Hook pattern:
  » Bear Hook is a day in which the open is below the previous day's low and the close 
is above the previous day's close with a narrow range relative to the previous day. As implied by 
the name there is a tendency for the price action following a Bear Hook to move to the downside. «

The Bull Hook pattern has two main forms:

Bull Hook 1: In a downtrend, the pattern is identified when today's bar is an up bar with a smaller range than the previous day and is an inside day (high lower, low higher than the previous bar). We buy with a stop order above the high of this bar.
Bull Hook 2: Here, today's bar is a down bar with a smaller range than the previous day, opening above the previous high and closing below the previous close. This pattern involves just two bars.


For testing, I used TradeStation with S&P 500 e-mini futures data. The backtest for Bull Hook 1 was disappointing, showing a loss with only 15 trades, which seemed unusual given its pullback nature. A deeper analysis suggested that the specific conditions, particularly the inside day and green bar requirements, were limiting trades. By removing some conditions, like the inside day and green bar, and focusing on a simpler pullback strategy, the results improved significantly with about 200 trades and positive performance metrics. For Bull Hook 2, the test also yielded fewer trades than expected, which might be attributed to its breakout nature, not performing well on the S&P 500. Simplifying the conditions here also improved the results somewhat, though it remained less effective. The Bear Hook pattern, when flipped for long trades, performed better but still had a low trade count. Removing some conditions and simplifying it increased the trade count and improved performance. While both Bull Hook patterns had potential, their effectiveness was highly dependent on specific conditions and the number of trades generated. Simplifying the patterns often led to better results.

Thursday, September 5, 2024

On Range Expansion, Monkey Hammers, FAFO & NFP Weeks | Stacey Burke

» When you get a range expansion, the market is sending you a very loud, clear signal 
that the market is getting ready to move in the direction of that expansion. «     
 —  Paul Tudor Jones 
  
» FAFO [F*** Around and Find Out] is when you try and scalp the high or scalp the low - or jump in because a market is moving - because something is up high or down low. If other time frame traders are driving the move ... be careful - that's called FAFO and is not a specific 90/10 easy money making trading setup. That's called gambling.

If the train has left the station ... find your next best candidate for your session that was on your watchlist. How is price behaving in the timing window - at the levels? No 90/10 easy money best playbook trading setup that you can see that is from your rinse and repeat templates? Then shut it down and walk away - or do what the experts do and hunt for science projects.

Behaviour of the trader - mindset of the trader - best 90/10 easy money playbook trading setup - timings - levels - behaviour of price - execution skills of the trader - behaviour of the trader after the trade is completed. Rin$e and repeat means exactly that ... same setups over and over and over again .
«
    — Stacey Burke

 
» It's a Non-Farm Payrolls week - don't be surprised to see a four-day template. The day count doesn't change. Wednesday was the reset day, and now we are in the backside of the week. We might get a monkey hammer on Thursday, and Friday setting up a Non-Farm Payrolls bounce trade. «     — Stacey Burke


Fed Chair Powell's promise to lower rates may trigger market reversals (HERE & HERE & HERE).

See also:

Friday, August 23, 2024

Recent Toby Crabel Price Pattern Setups in the E-mini S&P 500 Futures


Sunday, July 14, 2024

Trading Major News Events | D'onte Goodridge

News events typically inject momentum into the market, often prompting traders to anticipate where price might trend in response to the news. Making educated predictions about these movements is a common strategy rooted in technical analysis. Position yourself AFTER major news releases (NFP, CPI, PPI, PMI, FOMC etc.) with either a Pump & Dump or a Dump & Pump trading setup.


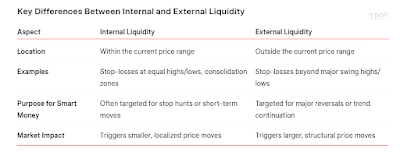
Sell Scenario/Setup: Wait for the buy side liquidity pool on the 15 minute timeframe to be raided first. After that, go to the 1 minute timeframe entry above the killzone's opening price. Then, anticipate that price will revert back down to a sell side liquidity level.
 
 
Buy Scenario/Setup: Wait for the sell side liquidity pool on the 15 minute timeframe to be raided first. After that, go to the 1 minute timeframe entry below the killzone's opening price. Then, anticipate that price will revert back up to a buy side liquidity level.
 
When price moves above the opening price of a killzone, it's in a premium. This is where to find ideal sell entries. 


When price moves below the opening price of a killzone, it's in a
discount. This is where to find ideal buy entries.

Wednesday, July 10, 2024

S&P 500 vs Tri-Annual, Yearly, Quarterly, Monthly, Weekly & Daily Pivot Levels

S&P 500 E-mini Futures (weekly candles) vs Tri-Annual Pivot Levels (for 2022-2024).
Based on spectrum analysis, Sergey Tarassov forcasted a multiyear high in US-stocks sometime 
around August 2024 between the crests of the 40 Month Cycle and the 42 Month Cycle
By then the tri-annual R1 level at 6,019 could well be reached. R2 is at 6,928.
 
S&P 500 E-mini Futures (weekly candles) vs Yearly Pivot Levels (for 2024).
Tri-Annual and Yearly Pivot Points and Levels are suitable for long-term investing or swing trading
with a time frame of several months to a year or more.

S&P 500 E-mini Futures (weekly candles) vs Quarterly Pivot Levels (for Q3 July-September 2024).
Quarterly Pivot Points and Levels are suitable for medium-term trading with a time frame of several 
weeks to a few months. They are useful for identifying intermediate support and resistance levels, 
trend continuations, and potential corrections.
.
S&P 500 E-mini Futures (daily candles) vs Monthly Pivot Levels (for (July 2024).
Monthly Pivot Points and Levels are ideal for short-term to medium-term trading 
with a time frame of several days to a few weeks.

S&P 500 E-mini Futures (daily candles) vs Weekly Pivot Levels (for July 07-12, 2024).
Weekly Pivot Points and Levels are suitable for short-term trading with a time frame of one to several
days to a week, to identify short-term support and resistance levels, trend continuations, and potential reversals.

S&P 500 E-mini Futures (4 hour candles) vs Daily Pivot Levels (for July 10, 2024).
Daily Pivot Points and Levels are ideal for short-term and intraday trading with a time frame of several hours to a day in order to identify short-term support and resistance levels, trend reversals, and potential breakouts. Daily Pivots can be used to make quick trading decisions, adjust stop-losses, or set price targets for the current trading session.
 

Pivot Points, Support and Resistance levels are calculated based on previous high, low, and close prices. These levels can identify areas, where price may bounce, reverse or break through, and where to set entry, stop-loss and take-profit orders. This technique is valid on various timeframes. Common types are Floor (Trader) Pivots a.k.a. Standard or Traditional Pivots (= all charts above), Central Pivot Range (CPR), Fibonacci, Woodie, Classic, Camarilla and DeMark Pivot Points, each type having their own calculation method.
 

See also:

Thursday, July 4, 2024

Structural Characteristics of Bullish & Bearish Months | D'onte Goodridge

Traders want to find trending markets but often fail to see and understand the structural characteristics of bullish and bearish months. Both move in a similar fashion but inverse to one another. Here are the characteristics for the formation of a bullish month:
 
 
The first example is a daily chart of US Dollar versus Japanese Yen (USDJPY) during February 2023. The market was trending up. It was a bullish month. Let's identify the five key factors to a bullish month:

1. Price moves below the monthly opening price.
2. A swing low forms below the month's open.
3. Price purges a previous daily low (PDL) and reverses back to a previous daily high (PDH).
4. The market creates a market structure shift (MSS) to the upside and an Imbalance or Fair Value Gap (FVG).
5. Higher swing highs and higher swing lows form.
 

Looking at the daily candles in the USDJPY chart, we see the methodical sequence of a Bullish Month developing:
 
1. Price was movesg below the monthly opening price. Price stops below it, runs up, drops below it, runs up and continues the bullish trend.
2. A swing low below the month's open forms. This is a swing low because the candle on the left has a higher low and the candle on the right has a higher low, hence the low in the middle is the lowest point. To form a swing low  only takes three bars.
3. Price purges a previous low and works back to a previous high. The following day price reverses back to the previous daily high, all happening within a three bar setup, creating a swing low, which is a purge on the previous daily low and a reversal back to a previous daily high.
4. Next the market creates a shift to the upside with speed through a previous swing high and a FVG.
5. And price created a new swing high and a higher swing low.

The next example is a daily chart of Apple during January 2023. The same five criteria for a Bullish Month were met:
 

Now let's look at the five key factors to a Bearish Month:

1. Price moves above the monthly opening price.
2. A swing high forms above the month's open.
3. Price purges a previous daily high and reverses back to a previous daily low.
4. The market creates a shift to the downside and a FVG.
5. Lower swing highs and lower swing lows form.
 

The first example is a daily chart of British Pound versus US Dollar during August 2022. The market was trending down. Identify the above listed five criteria for the formation of a Bearish Month:
 
 
The last example is a daily chart of Gold during February 2023. Gold was in a down trend. Identify the structural criteria for the formation of a Bearish Month: