Showing posts with label Ali Casey. Show all posts

Sunday, September 8, 2024

Toby Crabel’s Bull Hook Trading Strategy Tested | Ali Casey

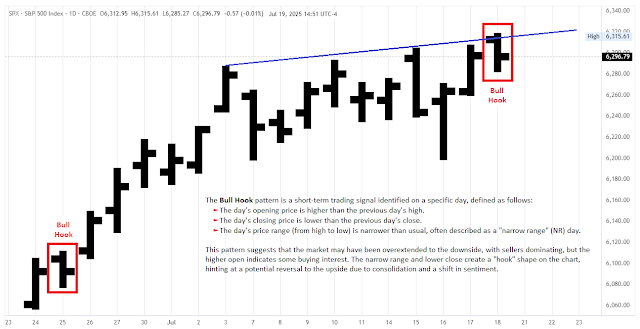
As an algo trader, I value patterns for their ease of programming and testing, which allows for the development of robust trading strategies. Today, we'll explore bull and bear hooks, patterns that can vary in details but generally serve to catch traders on the wrong side. Toby Crabel, Joe Ross, and Thomas Bulkowski, among others, have variations of these patterns.

Toby Crabel's original definition of the Bull Hook pattern:
» A Bull Hook occurs on Day 2. A Bull Hook is defined as a day with a higher open than the 
previous day's high followed by a lower close with a narrowing daily range. The next day (Day 1), 
a trade is taken on the initial move off the open, preferably to the upside. «
 
Toby Crabel's original definition of the Bear Hook pattern:
  » Bear Hook is a day in which the open is below the previous day's low and the close 
is above the previous day's close with a narrow range relative to the previous day. As implied by 
the name there is a tendency for the price action following a Bear Hook to move to the downside. «

The Bull Hook pattern has two main forms:

Bull Hook 1: In a downtrend, the pattern is identified when today's bar is an up bar with a smaller range than the previous day and is an inside day (high lower, low higher than the previous bar). We buy with a stop order above the high of this bar.
Bull Hook 2: Here, today's bar is a down bar with a smaller range than the previous day, opening above the previous high and closing below the previous close. This pattern involves just two bars.


For testing, I used TradeStation with S&P 500 e-mini futures data. The backtest for Bull Hook 1 was disappointing, showing a loss with only 15 trades, which seemed unusual given its pullback nature. A deeper analysis suggested that the specific conditions, particularly the inside day and green bar requirements, were limiting trades. By removing some conditions, like the inside day and green bar, and focusing on a simpler pullback strategy, the results improved significantly with about 200 trades and positive performance metrics. For Bull Hook 2, the test also yielded fewer trades than expected, which might be attributed to its breakout nature, not performing well on the S&P 500. Simplifying the conditions here also improved the results somewhat, though it remained less effective. The Bear Hook pattern, when flipped for long trades, performed better but still had a low trade count. Removing some conditions and simplifying it increased the trade count and improved performance. While both Bull Hook patterns had potential, their effectiveness was highly dependent on specific conditions and the number of trades generated. Simplifying the patterns often led to better results.
Sunday, June 9, 2024

Outside Bar Trading Setups | Larry Williams

In his book, 'Long-Term Secrets to Short-Term Trading', 2nd Edition, Chapter 7, Larry Williams provides price action patterns to profit. Larry Williams says that there are two daily bars that most confuse retail traders, the Inside Bar and the Outside Bar: 
 
» What the public 'sees' on their charts as being negative is most often apt to be positive for short-term market moves and vice versa. A case in point is an outside day with a down close. The day's high is greater than the previous day's high and the low is lower than the previous day's low and the close is below the previous day's low. This looks bad, like the sky is indeed falling in. In fact, the books I have read say this is an excellent sell signal, that such a wild swing is a sign of a market reversal in favor of the direction of the close, in this case down. [..] The problem is these outside day patterns do not occur as often as we would like! The next time you see an outside day with a down close lower than the previous day, don't get scared, get ready to buy ! « 

After an Outside Day with a Down Close lower than the previous day, BUY!
After an Outside Day with an Up Close higher than the previous day, SELL!

An Outside Bar is a bar that broke the previous bar's high and the previous bar's low. For related trading setups
Larry Williams specifically looked for outside bars on the daily time frame that closed below the previous daily low or closed above the previous daily high. After such a bar prints, a reversal in the price action should be expected. According to Larry Williams, Outside Bars only appear 7% of the time on the daily time frame.

This is what an outside bar with a down close looks like:


According to Larry Williams, this will be a buy set up in theory. Here we can see it looks bearish to the public eye because the close is below the low. This indeed can be a turning point. Enter long on the next daily open. The stop loss is below the low of the outside bar.
 
This is what an outside bar with an up close looks like:
 

This is a sell set up. It looks bullish to the public eye because the close is above the high. This indeed can be a turning point. Enter short on the next daily open. The stop loss is above the high of the outside bar. 
 
Targets should be logically related to buy side/sell side liquidity levels (previous highs and lows), Imbalances/Fair Value Gaps and/or 50% swing retracement levels. Consider only setups offering risk-to-reward ratios ≥ 1:2.
 
Don't expect every single Outside Bar setup to be a winner. Other setups and filters can nullify or optimize it (e.g. Oops Pattern, Smash Day, Day of the Week, trading in Premium or Discount, actual outside bar small range or large range, swing high or swing low recently broken, occurrence in 3 Day Cycle and 3 Week Cycle, close above/below 9-Day EMA, etc.). The video below shows Outside Bar Trading Setups on timeframes also smaller than the daily.