My style is based on the Taylor Trading Technique, a short-term method for trading daily price movements that relies entirely on odds and percentages. It is a method as opposed to a system. Very few people can blindly follow a system, though many find it easier to be discretionary in a systematic way.
Z
= Zigzag Day
(Sell Day or Exit Day). This represents a
consolidation or reversal-type day within the cycle, often where the market
shows a zigzag pattern, allowing for exits or potential fades. It is a key
transitional day.
B
= Buy Day.
This indicates a day favorable for initiating long positions or where buying
pressure is expected based on the cycle count.SS
= Sell (or Short) Day. This marks a day biased toward selling or shorting, often part of the
reaction or reversal phase in the cycle.
The labels in the chart above derive from Raschke's adaptation of the Taylor Trading Technique, which uses short-term (primarily 2-5 day) rhythmic cycles based on odds, previous highs/lows, and momentum shifts (often incorporating 2-period Rate of Change). The labels help traders anticipate the "correct play" each day. Her chart above illustrates four variations of market cycles using the B/Z/SS sequence. These are short-term swing cycles (typically 4-5 days) observed in daily charts:
(1) 4-Day
Cycle (Normal):
Sequence: B → Z → SS → B → Z → SS... A balanced cycle with alternating buying,
zigzag/consolidation, and selling pressure. Suitable for typical ranging or
mildly trending markets.
(2) 5-Day
Cycle (Uptrend, Low First): Sequence: B → Z → Z → SS → B → Z... Shows extension in
the upward direction with an extra Z (zigzag/consolidation) day. Emphasizes buying
opportunities after lows in an overall bullish bias.
(3) 5-Day
Cycle (Normal):
Sequence: B → Z → SS → Z → B → Z → SS... A standard longer cycle incorporating
more reaction days (Z and SS), common in moderate conditions.
(4) 4-Day
Cycle (Downtrend): Sequence: B → S (Z) → SS → B → Z → SS... Biased toward downward
movement, with stronger selling (SS) phases. Note the "S (Z)"
indicating a sell-oriented zigzag.
These cycles reflect the market's tendency to alternate between expansion and contraction, with primary direction moves often lasting 4 days in strong trends and reactions being shorter (1 day). Raschke provides a clear, rule-based mechanical approach and sequence to timing entries:
■ Start
searching for a buying day
2 days after a swing high, or conversely, a shorting day 2 days after a swing low. Ideally,
markets move in complete 5-day cycles. In a strong trend, expect 4 days in the
primary direction and only 1 day of reaction—thus, seek entry 1 day earlier than the standard
count.
■ Look for the market to test the previous day’s
low (for longs) or high (for shorts) early in the day, then reverse to form a
"check mark" pattern. This creates a strong support/resistance point
(double stop point) for better risk management. Avoid entries with only a
single stop point, as they suggest counter-trend weakness.■ Entries should align with the anticipated cycle day (B for longs, SS for
shorts). Use objective points like the prior day's high/low. If the trade
doesn't perform quickly, exit on the first reaction. Focus on minimizing risk
and anticipating rather than reacting.
Her framework emphasizes discipline, probability, and position management over prediction. It is best applied in markets with sufficient volatility and swing potential. Always combine with risk rules (e.g., tight stops for swings) and personal observation of the specific instrument.
Because of the short-term nature of this technique, swing traders must adhere to some very basic rules, including:
■ If the trade moves in your favor, carry it overnight--the odds favor follow-through. Expect to exit the next day around the objective point. An overnight gap presents an excellent opportunity to take profits. Concentrating on only one entry or one exit per day relieves the pressure.
■ If your entry is correct, the market should move favorably almost immediately. It may come back to test and/or exceed your entry point a little, but that's OK.
■ Do not carry a losing position overnight. Exit and play for better position the next day.
■ A strong close indicates a strong opening the following day.
■ If the market doesn't perform as expected, exit on the first reaction.
■ If the market offers you a windfall of big profits, take them to the bank on the close.
■ If you are long and the market closes flat, indicating a lower opening the following day, scratch or exit the trade. Play for better position the next day.
■ It is always OK to scratch a trade!
■ Use tight stops when swing trading (wider stops when trading trend).
■ The goal always is to minimize risk and create "Freebies."
■ When in doubt--get out! You have lost your road map and your game plan!
■ Place your orders at the market.
■ When the trade isn't working, exit on the first reaction. ANTICIPATE!

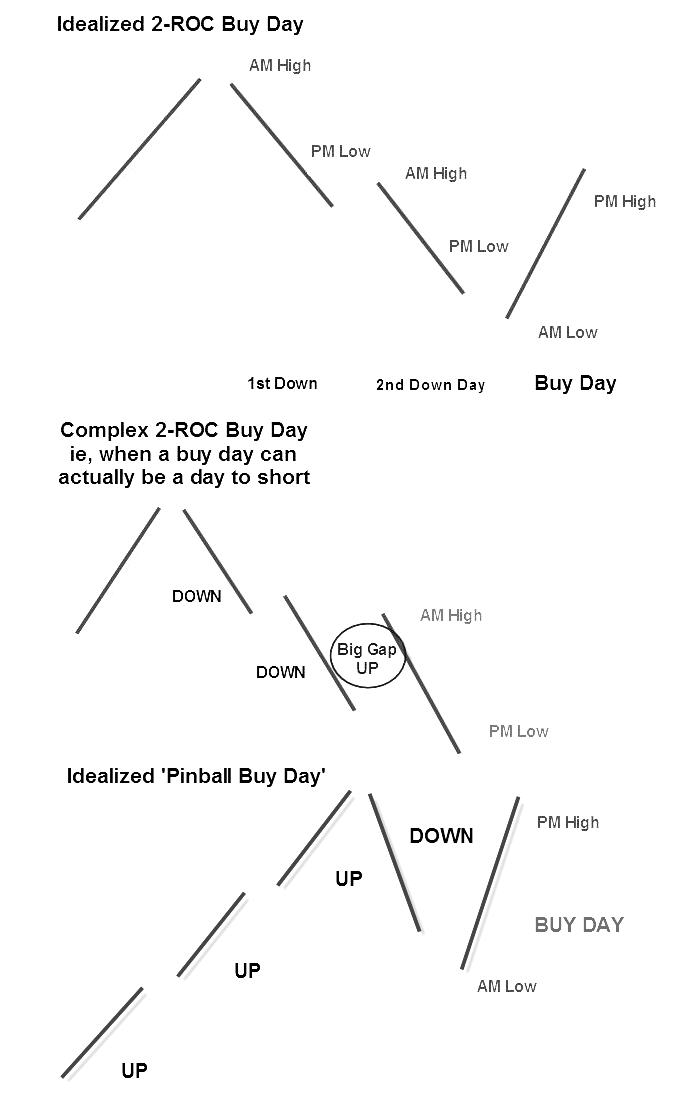
The chart above provides a clear visual guide to three distinct structural variations of Taylor's buying sequences, mapped out as zig-zag swing lines that track morning (AM) and afternoon (PM) price trajectories across consecutive days.
Idealized 2-ROC Buy Day: The top diagram illustrates the classic two-day Rate of Change (ROC) decline that sets up a standard long entry. The sequence begins with a "1st Down" day, which climbs early to an AM High before dropping to a PM Low. This bearish behavior repeats on the "2nd Down Day," which similarly creates an AM High and finishes weak at a PM Low, cementing a consecutive two-day drop. This multi-day decline perfectly coils the market for the scheduled "Buy Day." On this third day, the rhythm flips; the market drives downward to establish an AM Low first, which tests support and traps late breakout sellers, before reversing into a strong upward rally that finishes at a PM High.
Complex 2-ROC Buy Day (When a Buy Day Can Actually Be a Day to Short): The middle diagram outlines a critical structural exception, demonstrating how a scheduled buying session can twist into a highly effective shorting opportunity. The market pushes steadily downward over the preceding days, setting the stage for what traders expect to be a standard morning dip to buy. However, the market opens with a massive, disruptive change in behavior labeled as a circled "Big Gap UP." This massive open completely ruins the expected rhythm; instead of probing downward for a low, the market hits its AM High immediately at the opening bell. Because the buying pressure is completely exhausted by the gap, the price spends the rest of the day trending downward into a PM Low, transforming the scheduled Buy Day into a short trade.
Idealized 'Pinball Buy Day:' The bottom diagram details the "Pinball" variation popularized by Linda Raschke, which adapts Taylor's concepts to high-momentum uptrends. The sequence begins with a powerful, multi-day expansion consisting of three consecutive "UP" sessions. Following this extended run, the market experiences a sharp, one-day counter-trend flush labeled as a "DOWN" day. This sudden drop serves to shake out weak longs and reset overbought conditions without damaging the broader bullish framework. This single down day triggers the "BUY DAY" on the very next session, where the price dips early to find an AM Low before aggressively reversing upward to close at a PM High, seamlessly resuming the dominant uptrend.
How does one anticipate entry? The following may be indicators of a buy day or a sell day:
The Count
Start searching for a buying day 2 days after a swing high or, conversely, a shorting day 2 days after a swing low. Ideally, the market will move in complete 5-day cycles. (In a strong trend, the market will move 4 days in the primary direction and only 1 in reaction. Thus, one must seek entry 1 day earlier.)
"Check Mark" on the Test
The potential entry is sought opposite, or contrary to, the previous day's close. If looking to buy (sell), one first wants the market to "test" the previous day's low (high), preferably early in the day, and then form a trading pattern that looks like a "check mark" (see examples). This pattern sets up and establishes a "double stop point" or strong support. If entering a market with only a "single stop point" or support formed by today's low only, exit on the same day--the trade is clearly against the trend.
Close vs. Open
The close should indicate the following day's opening. When a market opens opposite what is expected or indicated by the trend, one may first look to "fade" it--but must take profits quickly. Then look to reverse!
Support (Resistance)
Is today's support (resistance) higher or lower than yesterday's?
Swing Measurements
Where is the market relative to the last swing high or low? Look for swings (up or down) of equal length, and for retracements of equal percentage.
No matter in what time frame, always look for supply at tops and support at bottoms. Penetrations should be accompanied by volume and activity. Expect trends, either up or down, to last for either 2 or 4 weeks. The following conditions are fairly reliable indicators for the start of one of these trends (I personally skip the first buy or sell swing when one occurs because the move ensuing could be quite strong):
■ Narrowest range in the last 7 days
■ 3 consecutive days with small range
■ The point of a wedge
■ A breakaway gap
■ A rising ADX (14-period) above 32
Practice
Because a certain amount of confidence in any technique is required to trade it consistently, paper trading can cultivate the faith necessary to recognize and trade pattern repetition. Although the temptation to try too many different styles and patterns always exists, one must strive ultimately to trade in just one consistent manner or at least to integrate techniques into your own unique philosophy.
System Characteristics
Certain points about trading short-term swings deserve note. Understanding the nature of short-term systems can help you recognize the psychological aspect of trading. When consistently following a short-term system, you should expect a very high win/loss ratio. Though the objectives with this style of swing trading appear conservative, you will almost always incur "positive slippage". In all systems, winners are skewed. Even though making steady profits, 3-4 really big trades may actually make the month. It is vitally important to always "lock in" your trades. Don't give back profits when short-term trading. You may be astonished at just how big some winners may be from catching the swings "just right!"
[...] Finally, I want to leave you with what I believe are two Golden Rules, applicable to all traders but, of essential importance to short-term swing traders:
■ NEVER, ever, average a loss! Sell out if you think you are wrong. Buy back when you believe you are right.
■ NEVER, NEVER, NEVER listen to anyone else's opinion! Only YOU know when your trade isn't working.
See also:


%20-%20Full%203%20Day%20Cycle%20Trading%20System%20%5B56%20p.%5D-03.png)

%20-%20Full%203%20Day%20Cycle%20Trading%20System%20%5B56%20p.%5D-07.png)
%20-%20Full%203%20Day%20Cycle%20Trading%20System%20%5B56%20p.%5D-08.png)


%20-%20ICT%20Turtle%20Soup.jpg)


%20-%20Trade%20Management%20%5B11%20p.%5D-04.png)
%20-%20Trade%20Management%20%5B11%20p.%5D-05.png)