 |
| The Parallel Aspect is formed between two planets with the same declination or distance north or south of the ecliptic. If the planets are both North or both South of the ecliptic, the parallel aspect is read as a conjunction. If they are the same declination but one is North and one is South, then the contra-parallel is read as a 180 degree opposition. These aspects are strongest when the orb is kept to 1 degree. They can also magnify the intensity of any other aspect between the two planets or points. Declination exceeding the extremes of the Sun's declination (= out of bounds = ± 23.27⁰ geocentric or ±7.15⁰ heliocentric) oftentimes correlates with (mostly minor) changes in trend in financial markets (HERE). Daily Declination Ephemerides can be found e.g. HERE Declinations and Latitudes can be calculated online e.g. HERE |
Saturday, December 1, 2018
Declinations of Sun, Moon and Planets 2019 | Parallels and Extremes
Geocentric and Heliocentric Bradley Indices │ Turning Points 2019


2018 Dec 03 (Mon) = Low (helio)
2018 Dec 18 (Tue) = High (geo+helio)
2019 Jan 17 (Thu) = Low (geo)
2019 Jan 21 (Mon) = Low (helio)
2019 Feb 07 (Thu) = High (geo)
2019 Feb 10 (Sun) = Low (geo)
2019 Feb 19 (Tue) = High (geo+helio)
2019 Feb 27 (Wed) = Low (geo)
2019 Feb 28 (Thu) = Low (helio)
2019 Mar 17 (Sun) = High (helio)
2019 Mar 18 (Mon) = High (geo)
2019 Mar 31 (Sun) = Low (geo+helio)
2019 Apr 11 (Thu) = High (geo+helio)
2019 Apr 19 (Fri) = Low (geo+helio)
2019 Apr 22 (Mon) = High (geo+helio)
2019 Apr 28 (Sun) = Low (geo+helio)
2019 May 16 (Thu) = High (geo+helio)
2019 May 30 (Thu) = Low (geo+helio)
2019 Jun 02 (Sun) = High (geo)
2019 Jun 03 (Mon) = High (helio)
2019 Jun 16 (Sun) = Low (geo)
2019 Jun 16 (Sun) = Low (helio)
2019 Jul 04 (Thu) = High (geo+helio)
2019 Jul 11 (Thu) = Low (geo)
2019 Jul 15 (Mon) = Low (helio)
2019 Jul 23 (Tue) = High (geo+helio)
2019 Jul 29 (Mon) = Low (geo+helio)
2019 Aug 07 (Wed) = High (geo)
2019 Aug 09 (Fri) = High (helio)
2019 Aug 15 (Thu) = Low (helio)
2019 Aug 16 (Fri) = Low (geo)
2019 Aug 22 (Thu) = High (geo)
2019 Aug 29 (Thu) = High (helio)
2019 Oct 07 (Mon) = Low (geo+helio)
2019 Oct 18 (Fri) = High (geo+helio)
2019 Oct 29 (Tue) = Low (helio)
2019 Oct 30 (Wed) = Low (geo)
2019 Nov 10 (Sun) = High (geo+helio)
2019 Nov 17 (Sun) = Low (helio)
2019 Nov 18 (Mon) = Low (geo)
2019 Nov 29 (Fri) = High (geo)
2019 Nov 30 (Sat) = High (helio)
2019 Dec 19 (Thu) = Low (geo)
2019 Dec 21 (Sat) = Low (helio)
2019 Dec 29 (Sun) = High (geo)
2020 Jan 08 (Wed) = High (helio)
2020 Jan 15 (Wed) = Low (geo)
2020 Jan 20 (Mon) = Low (helio)
2020 Feb 01 (Sat) = High (geo)
[calculated for
New York City]
Some background on the Bradley Indices
and previous turning points HERE
Some background on the Bradley Indices
and previous turning points HERE
 |
| Donald A. Bradley (1950) - Stock Market Prediction (HERE) |


S&P 500 Index vs Jupiter – Saturn Cycle | December 2018
 |
| Recent and upcoming turn-days: Nov 29 (Thu), Dec 04 (Tue), Dec 08 (Sat), Dec 12 (Wed), Dec 18 (Tue), Dec 25 (Tue), Dec 27 (Thu), Dec 29 (Sat), Jan 03 (Thu), Jan 08 (Tue). Previous turn-days HERE |
Cosmic Cluster Days | December 2018 - January 2019
 |
| Upcoming Cosmic Cluster Days in December and January are: Nov 28 (Wed), Dec 12 (Wed), Dec 14 (Fri), Dec 24 (Mon), Jan 10 (Thu), Jan 20 (Sun), Jan 23 (Wed), Jan 24 (Thu), Feb 02 (Sat). Previous CCDs are HERE |
 |
| Review of S&P 500 Index vs Cosmic Cluster Days in November 2018 | Preview for December 2018. |
SoLunar Map | December 2018 - January 2019
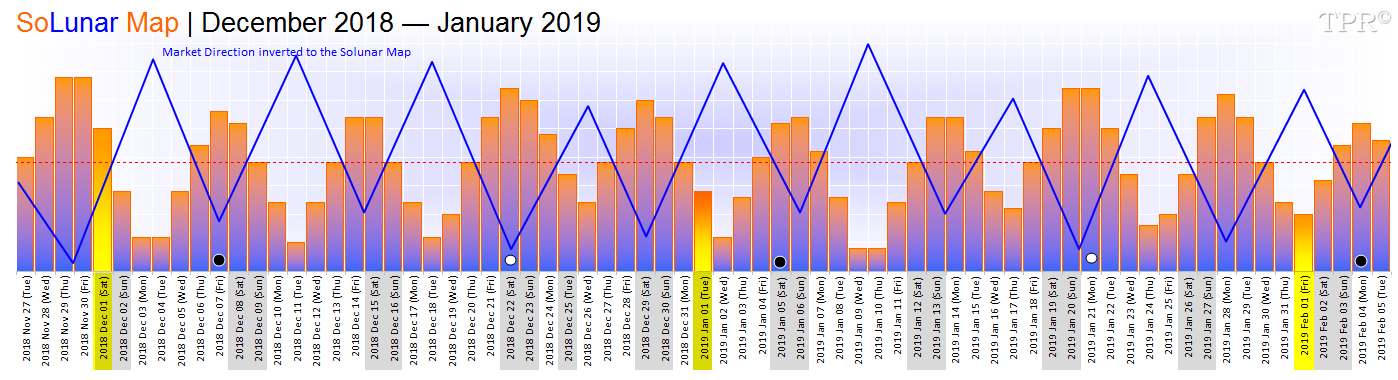 |
| Upcoming SoLunar Turn-Days are: Dec 04 (Tue), Dec 07 (Fri), Dec 11 (Tue), Dec 15 (Sat), Dec 18 (Tue), Dec 22 (Sat), Dec 26 (Wed), Dec 29 (Sat), Jan 02 (Wed), Jan 06 (Sun), Jan 09-10 (Wed-Thu), Jan 13-14 (Sun-Mon), Jan 17 (Thu), Jan 20-21 (Sun-Mon), Jan 24 (Thu), Jan 28 (Mon), Feb 01 (Fri). Previous SoLunar Maps HERE |

 |
| Review of S&P500 vs SoLunar Map during November 2018 | Preview for December 2018. |
Thursday, November 22, 2018
S&P 500 Index vs Sunspots | Transition between Solar Cycles #24 and #25


According to Hale’s Law, this means the two sunspots belong to different solar cycles. The high latitude sunspot appears to be a harbinger of Solar Cycle #25. Solar cycles always mix together at their boundaries. Indeed, ephemeral sunspots possibly belonging to Solar Cycle #25 have already been reported on December 20, 2016, and April 8, 2018. Now November 17, 2018, can be added to the list. The slow transition between Solar Cycle #24 and Solar Cycle #25 appears to be underway.
S&P 500 Index vs 18.61 Year Lunar Node Cycle | Nov 27 (Tue) Low
 |
| This 2000-2018 Analog projects some sort of a low on Nov 27 (Tue), some sort of a rally into Dec 09 (Sun), another decline into Dec 22 (Sat), a high on Dec 28 (Fri), and a low on Jan 05 (Sat). |
Tuesday, November 6, 2018
S&P 500 Index vs Lunar Node Speed | The Moon's Rhythm in November 2018
 |
| S&P 500 Index vs True Lunar Node Speed @ 0 and Extremes | 30 Day CIT Forecast. On Nov 07 (Wed) the lunar node's speed will reach a short term minimum. Stock indices are likely to move sideways-to-down from Nov 08 (Thu) into Nov 12 (Mon). |
Saturday, October 27, 2018
S&P 500 Index vs Jupiter – Saturn Cycle | November 2018
 |
| Recent and upcoming turn-days: Oct 22 (Mon), Oct 26 (Fri), Oct 30 (Tue), Nov 03 (Sat), Nov 08 (Thu), Nov 12 (Mon), Nov 16 (Fri), Nov 21 (Wed), Nov 25 (Sun), Nov 29 (Thu), Dec 04 (Tue), Dec 08 (Sat). Previous turn-days HERE |
Saturday, September 29, 2018
S&P 500 Index vs Jupiter – Saturn Cycle | October 2018
 |
| Recent and upcoming turn-days: Sep 25 (Tue), Sep 30 (Sun), Oct 05 (Fri), Oct 06 (Sat), Oct 07 (Sun), Oct 11 (Thu), Oct 16 (Tue), Oct 22 (Mon), Oct 26 (Fri), Oct 30 (Tue), Nov 03 (Sat), Nov 08 (Thu). Previous turn-days HERE |
Cosmic Cluster Days | October - November 2018
 |
| Upcoming Cosmic Cluster Days in October and November are: [Sep 23 (Sun)] Oct 04 (Thu), Oct 15 (Mon), Oct 23 (Tue), Oct 24 (Wed), Oct 26 (Fri), Oct 27 (Sat), Nov 11 (Sun), Nov 18 (Sun), Nov 28 (Wed), Dec 12 (Wed). Previous CCDs are HERE |
 |
| Review of S&P 500 Index vs Cosmic Cluster Days in September 2018 | Preview for October 2018. |
SoLunar Map | October - November 2018

 |
| Upcoming SoLunar Turn-Days are: Sep 28 (Fri), Oct 02 (Tue), Oct 06 (Sat), [Oct 08 (Mon) 22:08 = New Moon] Oct 09 (Tue), Oct 13 (Sat), Oct 17 (Wed), Oct 20 (Sat), Oct 24 (Wed) 14:26 = Full Moon, Oct 27 (Sat), Oct 31 (Wed), Nov 04 (Sun), Nov 07 (Wed) 09:23 = New Moon, Nov 08 (Thu), Nov 11 (Sun), Nov 15 (Thu), Nov 19 (Mon), Nov 23 (Fri) 02:10 = Full Moon, Nov 26 (Mon), Nov 30 (Fri), Dec 04 (Tue). Previous SoLunar Maps HERE |
 |
| Review of S&P500 vs SoLunar Map during September 2018 | Preview for October 2018. |
Monday, August 27, 2018
S&P 500 Index vs 18.61 Year Nodal Cycle | Aug 27, 2018 = Jan 14, 2000
 |
| Jan 14, 2000 (Fri = Major High in DJIA) + 6,800 CD = Aug 27, 2018 (Mon) A high should print around Aug 30 (Thu) ± 1 CD. Aug 30 will be also 195 Solar Degrees of geocentric longitude from the Major Low on Feb 09 (Fri) and 1,440 Lunar Degrees from the Low on May 03 (Thu). |
Saturday, August 18, 2018
S&P 500 Index vs W.D. Gann's Mass Pressure Chart | Update August 2018

 |
| Since early February the S&P 500 Index has closely been following the Gann Mass Pressure Chart, and suggests that August 7 (Tue) marked a major high and Aug 15 (Wed) an intermediate low. The rally should now pause for about two days into August 21 (Tue) before continuing into August 25 (Sat). Next would be a swing down into the last trading day of August. From there the Mass Pressure Chart moves sideways-to-down to another major low end of October. From there the Mass Pressure Chart rises into the last trading day of 2018. More on the concept of Gann's Mass Pressure Chart HERE |
Sunday, August 5, 2018
S&P 500 Index vs Natural Trading Days | Cluster ± August 8-9 (Wed-Thu)
 |
| Aug 08 (Wed) = 90 TD from Apr 02 (Mon) Low + 180 CD from Feb 09 (Fri) Low + True Lunar Node Speed @ Max + MOO @ Max N-Declination Aug 09 (Thu) = 135 TD from Jan 26 (Fri) Major High + SUN 000 MER + VEN contra parallel SAT (heliocentric) + VEN 120 URA (h) + VEN 090 SAT (h). |
 |
| S&P 500 Index vs True Lunar Node Speed @ 0 and Extremes | 30 Day CIT Forecast |
Saturday, August 4, 2018
S&P 500 Index vs Delta Cycle | August 2018 - Update
 |
| | Aug 06 (Mon) Low | Aug 7 (Tue) up + High | Aug 08 (Wed) Sideways-to-Low | Aug 09 (Thu) Sideways-to-High | Aug 10 (Fri) Sideways-to-Low | Aug 13-15 (Mon-Wed) High. There will be a Partial Solar Eclipse (Super New Moon) on Aug 11 (Sat) 09:46 (EDT). |
Russell 2000 Index vs Delta Cycle | August 2018 - Update
 |
| | Aug 06 (Mon) Low | Aug 7 (Tue) up + High | Aug 08 (Wed) Sideways-to-Low | Aug 09 (Thu) Sideways-to-High | Aug 10 (Fri) Sideways-to-Low | Aug 13-15 (Mon-Wed) High | |
Sunday, July 29, 2018
S&P 500 Index vs Delta Cycle | August 2018
 |
| Jul 30 (Mon) Low | Aug 2 (Thu) High | Aug 06 (Mon) Low | Aug 15 (Wed) High | Aug 30 (Thu) Low | Sep 10 (Mon) High |
S&P 500 Index vs Delta of Inverted VIX | August 2018
 |
| Jul 30 (Mon) Low | Aug 2 (Thu) High | Aug 06 (Mon) Low | Aug 14 (Tue) High |
Russell 2000 Index vs Delta Cycle | August 2018
 |
| Jul 30 (Mon) Low | Aug 2 (Thu) High | Aug 06 (Mon) Low | Aug 15 (Wed) High |
S&P 500 Index vs Lunar Declination + Latitude | August 2018
 |
| Recent and upcoming events: Jul 27 (Fri) 16:20 + 18:38 = Full Moon + MOO Lat @ 0 = Total Lunar Eclipse = SoLunar Turn-Day Jul 31 (Tue) 22:27 = SoLunar Turn-Day Aug 02 (Thu) 04:29 = MOO Dec @ 0 Aug 04 (Sat) 02:16 = MOO Lat @ Min + SUN 270° MOO = SoLunar Turn-Day Aug 07 (Tue) 01:49 = SoLunar Turn-Day Aug 08 (Wed) 18:22 = Moon Declination @ Max Aug 10 (Fri) 14:01 = Moon @ Perigee Aug 11 (Sat) 04:23 = SoLunar Turn-Day = Partial Solar Eclipse (Super New Moon) Aug 15 (Wed) 10:52 = SoLunar Turn-Day Aug 16 (Thu) 15:31 = Moon Latitude @ Max Aug 18 (Sat) 03:32 = SUN 090 MOO = 1st Q Aug 19 (Sun) 00:25 = SoLunar Turn-Day Aug 21 (Tue) 22:57 = Moon Declination @ Min Aug 22 (Wed) 02:33 = SoLunar Turn-Day Aug 23 (Thu) 07:55 = Moon @ Apogee Aug 26 (Sun) 09:46 = SoLunar Turn-Day = Full Moon = SUN 180 MOO Aug 29 (Wed) 09:11 = SoLunar Turn-Day Aug 31 (Fri) 07:20 = Moon Latitude @ Min Sep 02 (Sun) 22:48 = SUN 270° MOO = 3rd Q Sep 03 (Mon) 13:24 = SoLunar Turn-Day [all times calculated for New York City = EST/EDT] |
Saturday, July 28, 2018
S&P 500 Index vs Jupiter – Saturn Cycle | August 2018
 |
| Recent and upcoming turn-days: Jul 29 (Sun), Aug 02 (Thu), Aug 07 (Tue), Aug 11 (Sat), Aug 15 (Wed), Aug 21 (Tue), Aug 29 (Wed), Aug 31 (Fri), Sep 01 (Sat), Sep 06 (Thu), Sep 11 (Tue). Previous turn-days HERE |
S&P 500 Index vs Cosmic Cluster Days | August 2018
 |
| Upcoming Cosmic Cluster Days are: Jul 28 (Sat), Jul 31 (Tue), Aug 13 (Mon), Aug 14 (Tue), Aug 19 (Sun), Aug 22 (Wed), Aug 24 (Fri), Sep 06 (Thu). Previous CCDs are HERE |
Thursday, July 26, 2018
Google Removes Security Warnings Related To Time Price Research URL
 |
| In December 2017 Google suddenly started assigning security threats (malware, phishing etc.) to the URL of this blog. Thanks to Google's absurd claims and security alerts the monthly page-views rapidly declined from an average of 158,000 down to 23,000 in June 2018. Seven requests to Google to please review this issue were ignored. Only yesterday Google pointed out that "http://time-price-research- astrofin.blogspot.com/ no longer contains links to harmful sites or downloads", and "warnings visible to users are being removed". Thank you, dear Google! See also HERE |
Saturday, July 21, 2018
S&P 500 Index vs Lunar Year Cycle | Blood Moon Eclipse on July 27
 |
| The total phase of the "blood moon" eclipse on July 27 (Fri) will last 1 hour and 43 minutes and will be the longest total lunar eclipse of the 21st century. During the eclipse the Moon will turn into a spectacular red whilst the red planet Mars reaches opposition to the Sun on the very same day. Mars will appear brightest in the night sky from July 27 (Fri) to July 30 (Mon), and its closest approach to Earth will occur on July 31 (Tue). The wobble periods of the Moon during lunar and solar eclipses usually coincide with major highs and lows in financial markets, and the Lunar Year Cycle (354.36 Calendar Days) projects a low in the S&P 500 to August 8 (Wed) which is also 181 Calendar Days (or 184.74 solar degrees) away from the major low in stocks on February 8 (Thu), 2018. |
 |
| July 23-24 (Mon-Tue) Low and upturn, July 27 (Fri) High, and August 8 (Wed) Low in the S&P 500? |
 |
| Major Celestial Phenomena during late July and early August 2018. Source: NAO of Japan |
SoLunar Map | August - September 2018
 |
| This SoLunar Map depicts the bias for short-term movements of stock indices two months ahead. Of course financial markets are influenced also by other planetary forces, but a 3-5 day short-term rhythm and pattern is governed by the SoLunar forces (= 4 highs and 4 lows per lunar month). The soLunar forces are a composite of Sun-Moon angles, orbital eccentricities, declinations and some long-term cycles. A Low in the SoLunar Map frequently is a High in the stock market and vice versa. Inversions occur, and if so, they should occur only once every 4 lunar months around a New Moon (max +/- 7 days). The SoLunar Rhythm is frequently disturbed by (1.) the FED, and (2.) by sudden solar activity, altering the geomagnetic field, and hence the mass mood. This can result in the skip and/or inversion of pivots in the SoLunar Map. An increasing number of sunspots and flares have usually a negative influence on the stock market some 48 hours later, and vice versa (Ap values > 10 are usually short-term negative). A rising blue line in the SoLunar Map means the bias for the market is side-ways- to-up, and vice versa. Highs and lows in the SoLunar Map also may coincide with the start and termination of complex, side-ways correction patterns like zig-zags, triangles or flags. |
 |
| Upcoming SoLunar Turn-Days are: Jul 24 (Tue), Jul 27 (Fri), Jul 31 (Tue), Aug 04 (Sat), Aug 07 (Tue), Aug 11 (Sat) 04:23 = New Moon, Aug 15 (Wed), Aug 19 (Sun), Aug 22 (Wed), Aug 26 (Sun)) 09:46 = Full Moon, Aug 29 (Wed), Sep 03 (Mon), Sep 06 (Thu), Sep 09 (Sun) 12:24 = New Moon, Sep 13 (Thu), Sep 17 (Mon), Sep 21 (Fri), Sep 24 (Mon) [Full Moon = Sep 25 (Tue) 00:39], Sep 28 (Fri), Oct 02 (Tue). Previous SoLunar Maps HERE |
 |
| Review of S&P500 vs SoLunar Map during July 2018 | Preview for August 2018. Recent and upcoming SoLunar Turn-Days: Jul 31 (Tue), Aug 04 (Sat), Aug 07 (Tue), Aug 11 (Sat), Aug 15 (Wed), Aug 19 (Sun), Aug 22 (Wed), Aug 26 (Sun), Aug 29 (Wed), Sep 03 (Mon). |
Cosmic Cluster Days | August - September 2018
 |
| The assumption is that heliocentric and geocentric angles between planets coincide with changes in trend in financial markets. A signal is triggered when the composite line of all aspects breaks above or below the Cosmic Noise Channel. From July 24 (Tue) into the end of July we will experience the densest Cosmic Cluster period during the entire year 2018: Jul 24 (Tue), Jul 25 (Wed), Jul 26 (Thu), Jul 27 (Fri), Jul 28 (Sat), Jul 31 (Tue). Upcoming Cosmic Cluster Days in August and September are: Aug 13 (Mon), Aug 14 (Tue), Aug 19 (Sun), Aug 22 (Wed), Aug 24 (Fri), Sep 06 (Thu), Sep 22 (Sat), Sep 23 (Sun), Oct 04 (Thu), Oct 15 (Mon). Previous CCDs are HERE |
 |
| Review of S&P 500 Index vs Cosmic Cluster Days in July 2018 | Preview for August 2018: And just ahead of us is the biggest Cosmic Cluster during 2018: July 24-28 (Tue-Sat). |
Saturday, July 14, 2018
S&P 500 Index vs Lunar Declination + Latitude + Composite | July 2018
 |
| Recent and upcoming events: Jun 28 (Thu) 10:26 = MOO Dec @ Min Jun 29 (Fri) 22:18 = MOO @ Apogee Jun 30 (Sat) 12:44 = MOO Lat @ 0 Jul 02 (Mon) 00:00 = SoLunar Turn-Day (HERE) Jul 05 (Thu) 22:01 = MOO Dec @ 0 Jul 06 (Fri) 00:00 = SoLunar Turn-Day Jul 07 (Sat) 19:19 = MOO Lat @ Min Jul 09 (Mon) 00:00 = SoLunar Turn-Day Jul 12 (Thu) 07:51 + 22:47 = MOO Dec @ Max + New Moon Jul 13 (Fri) 22:51 = MOO Lat @ 0 + MOO @ Perigee = Partial Solar Eclipse = SoLunar Turn-Day Jul 16 (Mon) 00:00 = SoLunar Turn-Day Jul 18 (Wed) 11:19 = MOO Dec @ 0 Jul 20 (Fri) 08:26 = MOO Lat @ Max = SoLunar Turn-Day Jul 24 (Tue) 00:00 = SoLunar Turn-Day Jul 25 (Wed) 16:52 = MOO Dec @ Min Jul 27 (Fri) 16:20 + 18:38 = Full Moon + MOO Lat @ 0 = Total Lunar Eclipse = SoLunar Turn-Day Jul 31 (Tue) 00:00 = SoLunar Turn-Day Aug 02 (Thu) 04:29 = MOO Dec @ 0 Aug 04 (Sat) 02:16 = MOO Lat @ Min + SUN 270° MOO = SoLunar Turn-Day [all times calculated for New York City = EST/EDT] |
S&P 500 Index vs Declinations of Mercury, Venus and Moon | July 2018
 |
| Lunar declination will be parallel to Mercury's on July 15 (Sun), and parallel to Venus' on July 16 (Mon), at +5°58'30" on July 17 (Tue), at -5°58'30" on July 20 (Fri), at maximum south on July 26 (Thu), and at -5°58'30" again on August 1 (Wed) when Mercury's declination reaches minimum. Miles Wilson Walker's Declination Composite (= (MAR_Dec+MERC_Dec)-VEN_Dec) will change the trend on July 23 (Tue). |
Russell 2000 Index vs Delta Cycle | July 2018
 |
| If the polarity of the 4 Lunar Month Cycle continues, the Turn-Days next week should be: July 16 (Mon) Low, July 17 (Tue) High, July 20 (Fri) Low. If the polarity flipped around the latest solar eclipse, next Monday would be a High, Tuesday a Low, etc. |
S&P 500 Index vs Jupiter – Saturn Cycle | July 2018
 |
| Recent and upcoming turn-days: Jun 26 (Tue), Jun 29 (Fri), Jul 03 (Tue), Jul 08 (Sun), Jul 13 (Fri), Jul 16 (Mon), Jul 20 (Fri), Jul 25 (Wed), Jul 29 (Sun), Aug 02 (Thu), Aug 07 (Tue). Previous turn-days HERE |
Subscribe to:
Posts (Atom)