Showing posts with label Larry Williams. Show all posts

Tuesday, July 26, 2022

Range, 3 Day SMA, Day Counts & Reversal Harbingers

A day in which there is a new high followed by a lower close is a downwards reversal day (RB). An upwards reversal day is a new low followed by a higher close. A reversal day by itself is not significant unless it can be put into context with a larger price pattern, such as a clear trend with sharply increasing volatility, or a reversal that occurs at the highest or lowest price of the past few weeks. Short-term reversals are likely after wide-ranging (WR4) and narrow-ranging days (NR4), especially when the open, high, low and close of the daily price bar are altogether above or below of a simple three-day moving average line of daily close prices.

A wide-ranging day is likely to be the result of a price shock, unexpected news, or a breakout in which many orders trigger one another, causing a large increase in volatility. A wide-ranging day could turn out to be a spike or an island reversal. Because very high volatility cannot be sustained, a wide-ranging day will likely be followed by a reversal, or at least a pause. When a wide-ranging day occurs, the direction of the close (if the close is near the high or low) is a strong indication of the continued direction. An outside day (OB) often precedes a reversal. An outside day can also be a wide-ranging day if the volatility is high, but when volatility is low and the size of the bar is slightly longer than the previous bar, it is a weak signal. As with so many other chart patterns, if one day has an unusually small trading range, followed by an outside day of normal volatility, there is very little information in the pattern. Context and selection are important.

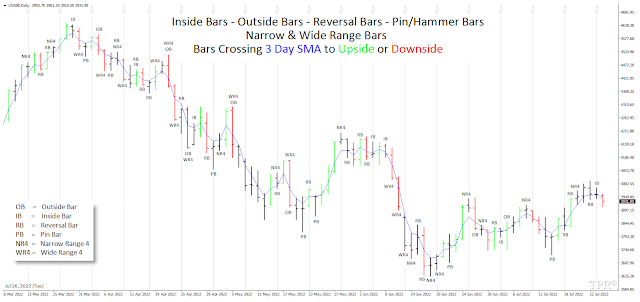
An inside day (IB) is one where the high is lower than the previous high and the low is higher than the previous low. That is, an inside day is one where both the highs and lows are inside the previous day’s trading range. An inside day represents a narrow range consolidation and lower volatility. In turn, lower volatility is most often associated with the end of a price move. After a burst of activity and a surge of direction, price has reached a point where buyers are already in and price has moved too far to attract more buyers. Volume drops, volatility drops, and an inside day follows. An inside day is definitely followed by a breakout, either into a continuation of the previous trend or into a change of direction. 

Sunday, July 10, 2022

3 Bar Patterns | The Smallest Fractals of Market Structure

"Any time there is a daily low with higher lows on both sides of it, that low will be a short-term low. We know this because a study of market action will show that prices descended in the low day, then failed to make a new low, and thus turned up, marking that ultimate low as a short-term point. A short-term market high is just the opposite. Here we will see a high with lower highs on both sides of it. What this says is that prices rallied up to the zenith of that middle day, then began to move back down, and in the process formed a short-term high. For our purposes in identifying short-term swing points, we will simply ignore inside days and the possible short-term points they produce." This is how Larry Williams defined market structure. His concept is universal and applies to all bars of all time frames.

  • A Short-Term High (STH) is a bar with a high greater than or equal to the high of the bar to the left and greater than the bar high to the right. Neighboring bars should not be inside. If they are inside bars, the bars that follow them should be analyzed.
  • A Medium-Term High (MTH) has Short-Term Highs to the left and and to the right that are below the high of this bar.
  • A Long-Term High (LTH) has Medium-Term Highs to the left and and to the right that are below the high of this bar.

And for the lows it’s all vice versa: 

  • Short-Term Low (STL) = bar with higher lows on both sides
  • Intermediate-Term Low (ITL) = higher STL on both sides
  • Long-Term Low (LTL) = higher ITL on both sides

In other words: 3 bar patterns are the smallest fractals and building blocks of market structure. Since price is always either in consolidation, in an uptrend or in a downtrend 3 successive price bars must form either a directional pattern (higher highs, higher lows or vice versa), a continuation pattern (inside bar) or a reversal pattern (outside bar, pin bar, head & shoulder, M&W patterns) (see also HERE):

  
References:

Monday, July 4, 2022

In Any Bar Chart Only 8 Possible Range Patterns | Larry Williams

Larry Williams presented a free session at the November 2014 Las Vegas Traders Expo in which he discussed 8 possible Range Patterns. He showed that from any bar to the next there are only 4 possible outcomes:

  1. Down Range: Last Bar's high is lower than prior Bar's high; and last Bar's low is lower than prior Bar's low.
  2. Up Range: Last Bar's high is higher than prior Bar's high; and last Bar's low is higher than prior Bar's low.
  3. Inside Range: Last Bar's high is lower than prior Bar's high; and last Bar's low is higher than prior Bar's low. On a Daily S&P500 Chart this occurs approximately 12% of the time.
  4. Outside Range: Last Bar's high is higher than the prior Bar's high; and Bar's low is lower than the prior Bar's low. On a Daily S&P500 Chart this occurs approximately 12% of the time.

Price action cannot occur in any other way. Within these 4 Range Patterns each last bar can either be an up bar or a down bar. So there are actually 8 possible Range Patterns:

1. Down Range, Down Day
2. Down Range, Up Day
3. Up Range, Down Day
4. Up Range, Up Day
5. Inside Range, Down Day
6. Inside Range, Up Day
7. Outside Range, Down Day
8. Outside Range, Up Day

Using these 8 patterns some powerful strategies can be created. Larry Williams presented back-tested statistics associated with trading these patterns using a simple entry and exit technique. He stressed that they were not the best entry or exit techniques but shown because they were easy to understand and program. This strategy is intended only to show where we have a bias or advantage in the marketplace.

  • Entry: At market close
  • Stop Loss: Based on $ Stop
  • Exit: First Profitable Opening

His message was that we could go home and verify using our own software. His results for testing this on the e-mini S&Ps from 2002 forward [to 2015] were as follows:


So, the Down Range, Down Close day [1.] offers the best potential short term 'long' setup based on net profit. This was the take-home message of the presentation.

Larry further dug into the Down Range, Down Close setup to uncover which day of the week offered the best trade: The stats support the 'Turnaround Tuesday' concept.


And further investigating by Trading Day of Month revealed that 1, 17, 19, 22 and 23 were the best days, showing 92% winners and $47,500 net profits with 107 trades.

It was also found that a Down Range Larger Range day was better than a Down Range smaller Range day. $205 Avg 80% Win, vs $33 Avg 85% win,

Also naked close was better than a covered close (naked close meaning that the close was outside of the previous day’s range). $155 Avg 83% Win vs $30 Avg 83% Win

And combining these two concepts:
Down Range, larger range, Covered close: $60 Avg, 83% Winners
Down Range, larger range, Naked close: $215 Avg, 85% Winners

References:

Monday, May 30, 2022

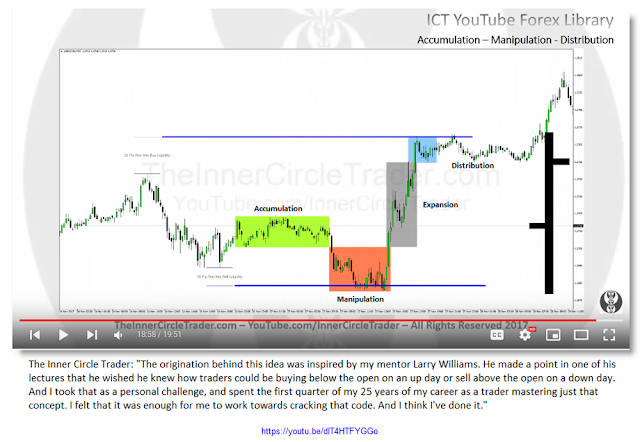
Daily Range = Accumulation + Manipulation + Expansion + Distribution (AMD)

Accumulation (A) of positions generally occurs during the Asian session. The accumulation is characterized by being a consolidation.

Manipulation (M) usually occurs at the opening of the London session (sometimes at the NY open). It consists of taking the price to the opposite side of the true directional Expansion of the rest of the day.

Distribution (D) occurs when Market Makers liquidate (exit) their positions.

This AMD-Principle is represented in every bar of every time-frame (monthly, weekly, daily, 4 Hour, etc.) with a price value at which it starts trading (opening price), the highest price value (high), the lowest (low), and  a value of the time it ends trading (close). The AMD-Principle can be observed in all financial markets - Forex, stocks, indices, commodities, bonds, etc.


Michael J. Huddleston a.k.a. The Inner Circle Trader:
“The origin behind this idea was inspired by my mentor Larry Williams.
He made a point in one of his lectures that he wished he knew
how traders could be buying below the open on an up day or sell above the open on a down day.
And I took that as a personal challenge, and spent the first quarter of my 25 years
of my career as a trader mastering just that concept.
I felt that it was enough for me to work towards cracking that code.
And I think I've done it.”
 
References
 
See also:

Thursday, December 13, 2018

Contraction > Breakout > Expansion | Toby Crabel's Price Patterns

Larry Williams described all of market's action
in 8 patterns characterized by direction, contraction
and expansion (e.g. HERE)
In 1990 Toby Crabel published Day Trading With Short Term Price Patterns and Opening Range Breakout. The book is about the fundamental nature of price action, about contraction and expansion, the ebb and flow of price in all markets. Looking at daily bar charts, expect breakouts and / or changes in trend after the following price bar patterns:
 
Narrow Range (NR): A price bar's range less than the previous bar's range. The opposite of NR is Wide Spread (see below). NR is technically NR2 when compared to NR4, NR5, and NR7 (see below; more e.g. HERE).  

Narrow Range 4 (NR4): A price bar's range less than the previous 3 bars' ranges is the narrowest range in 4 days or NR4. The opposite is WS4 (see below; more e.g. HERE). 

On Dec 13 (Thu) the E-mini Nasdaq 100 Futures and other US stock indices performed a IDnr4 down day.

Narrow Range 5 (NR5): A price bar's range less than the previous 4 bars' ranges is the narrowest range in 5 days or NR5. The opposite is WS5.
 

Narrow Range 7 (NR7): A price bar's range less than the previous 6 bars' ranges is the narrowest range in 7 days or NR7. The opposite is WS7 (more e.g. HERE).

Wide Spread (WS): A price bar's range wider than the previous bar's range is a WS. The opposite is NR. WS is technically WS2 when compared to WS4, WS5, and WS7 (more e.g. HERE).
 

Wide Spread 4 (WS4): A price bar's range wider than the previous 3 bars' ranges is the widest range in 4 days or WS4. The opposite is NR4.
 

Wide Spread 5 (WS5): A price bar's range wider than the previous 4 bars' ranges is the widest range in 5 days or WS5. The opposite is NR5. 

Wide Spread 7
(WS7): A price bar's range wider than the previous 6 bars' ranges is the widest range in 7 days or WS7. The opposite is NR7.

Inside Day (ID): If the high of the current day is lower than the high of the previous day AND the low of the current day is higher than the low of the previous day we have an ID or Inside Day. The opposite is an OD (more e.g. HERE).

Outside Day (OD): If the high of the current day is higher than the high of the previous day AND the low of the current day is lower than the low of the previous day then we have an OD or Outside Day. The opposite is an ID
(more e.g. HERE).

Inside Day (ID) and NR4 (
IDnr4): An IDnr4 is a combination of an ID and a NR4. This happens when the current day's high is lower than the previous day's high AND the current day's low is higher than the previous day's low AND the range is the narrowest when compared to the previous 3 trading days (more e.g. HERE).

2 Bar Narrow Range (
2BNR): The 2-day-range (the higher of the 2 highs less the lower of the 2 lows) is the narrowest 2-day-range in the last 20 trading sessions.

3 Bar Narrow Range (3BNR): The 3-day-range (the higher of the 3 highs less the lower of the 3 lows) is the narrowest 3-day-range in the last 20 trading sessions.

4 Bar Narrow Range (
4BNR): The 4-day-range (the higher of the 4 highs less the lower of the 4 lows) is the narrowest 4-day-range in the last 30 trading sessions.

8 Bar Narrow Range (
8BNR): The 8-day-range (the higher of the 8 highs less the lower of the 8 lows) is the narrowest 8-day-range in the last 40 trading sessions.

BearHook: A NR with the Open less than the previous bar's Low AND the Close greater than the previous bar's Close (more
e.g. HERE).

BullHook: A NR with the Open greater than the previous bar's High AND the Close less than the previous bar's Close (more
e.g. HERE).

Stretch: The Stretch is calculated by taking the 10 period SMA of the absolute difference between the Open and either the High or Low, whichever difference is smaller. For example: if Open = 1,250, High = 1,258, Low = 1,240, then take the value of 8 for that day because 1,258 - 1,250 = 8 which is smaller than 1,250 - 1,240 = 10. Then add together all of these values for the last 10 trading days and divide this by 10 to get the 10 day SMA. This value will then become the Stretch. The Stretch is used in calculating where to enter the trade and where to place a stop using the ORB and ORBP trading strategies (see below). 


Simple Moving Average (SMA): An SMA is calculated over a number of candles/bars in a chart as the simple average value of that number of bars, e.g. the SMA for the last 10 days closing prices of the DJIA: add together the closing prices for the last 10 days of the DJIA and then divide that by 10 = 10 day SMA. You do not need to use just the closing price to calculate this. You can also use the Open, High, Low, and Close or a combination of any of those, e.g. HLC/3.

Opening Range Breakout (ORB): Using this strategy, a buy stop is placed just above the Open price plus the Stretch and a sell stop just below the Open price minus the Stretch. The first stop triggered enters the trader into the trade and the other stop becomes the protective stop. The earlier in the trading session the entry stop is hit the more likely the trade will be profitable at the close. A market movement that kicks off a trend quickly in the current trading session could add significant profit to a trader's position by the close and should be considered for a multi-day trade. As time passes and we are not filled early on then the risk increases and it becomes prudent to reduce the size of the position during the day. Trades filled towards the end of the day carry the most risk and the later in the day the trade is filled the less likely the trader will want to carry that trade overnight (more
e.g. HERE).

Variations of this strategy include the
Opening Range Breakout Preference (ORBP): An ORBP trade is a one sided ORB trade. If other technical indicators show a strong trend in one direction then the trader will exercise a "Preference" for the direction in which to trade the ORB trade. A stop to open a position would be placed on the side of the trend only and if filled a protective stop would then be placed. The calculation of where to place the "stop to open" would be the same as that for the ORB trade: For longs, the Open price plus the Stretch and for shorts the Open price minus the Stretch. The ORBP trade is a specialized form of the ORB trade (more e.g. HERE). 

Sunday, November 12, 2017

90% Bullish Larry Williams Trading Setup for S&P500 Futures


One of Larry Williams' Long-Term Secrets to Short-Term Trading is about an Outside Day with a down close [Day 1] followed by an Inside Day [Day 2]. This is a very reliable bullish short term trading setup: Bought the next day at the open [Day 3], this setup is profitable in the S&P500 90% of the time. Expect the ES/Emini to rise above Day 1 (HERE).

Saturday, July 11, 2015

Forecasting the NYSE with the Jupiter-Saturn Cycle | L.H. Weston


[...] Diagram A is designed to show the curve of influence produced on stock market prices by the varying angular distances of Jupiter from conjunction or opposition with Saturn. It will be seen that at 0 years and 0°, which is supposed to represent the time of geocentric conjunction and opposition of the planets, the dotted curve, which is our composite price of stock in the 10-year cycle, starts a little below the mean circle; then late in year 1 when distance is about 18° between the planets it goes to maximum height; then drops low in middle of year 3 at 54°; rises to late in year 5 or 90°; drops soon to a little late in the 7th year at 126°; rises slowly to past the 9th year or 162°; lastly, comes to a little below the mean again at 10 years, 180°, same as at beginning. Then at 180° another 10-year cycle starts and repeats this movement, and so on to eternity. It is thus seen, by the dotted curve in this diagram that Jupiter and Saturn cause maximum and minimum prices in the stock market when their geocentric angular distances between each other are about as follows:
 
Max.    Min.
18°    54°
90°    126°
          162°   180° and 0°
 
This dotted curve shows positively that the planetary influence is what we call harmonic, meaning a wave-like motion, fixed in angular position like the crystals of a snow flake (hydrogen at low temperature) with 2 minor axis that join at 72°, as illustrated by the central part of diagram A." [pp. 35-36]

See also HERE

General consensus within the astro-financial community traces the primary development of modern financial astrology to around the 1920s, when W.D. Gann mentioned a planet for the first time in a 1921 Forecasting Course and Professor J.H. Weston self published his breakthrough work 'Forecasting the New York Stock Market' (manuscript, no binding, 47 pages). Also in the early 1920s Sepharial produced most of his known 'Arcana' or 'Keys' to the markets, though he stated in his advertisements that these systems had been in development since 1898. However Professor Weston represents the earliest application of Fourier Sequences to market analysis, by breaking down component cycle waves and combining them to produce a composite model. 

J.H. Weston was a regular contributor to Frederick White's journal 'The Adept' (e.g. HERE) and also one of the first to propose a 'Decennial Cycle' theory, actually with two different versions of the ten year pattern. The first is his computation based on 50 years of data, of a series composed of 14, 20 and 28 months, called the Venus term and based upon the heliocentric system. The second is a sequence which divides the Jupiter-Saturn cycle into 10 irregular parts, but follows the geocentric system. Professor Weston was a great influence on W.D. Gann, implied by his manuscript being locked in Gann's safe, and he may have been the one who introduced Gann to Fourier cycle theory, providing Gann with the foundation for his 10 year cycle with its multiples.

Reference:
L.H. Weston (1921) - Being a Treatise on the Geometrical or Chart System of Forecasting in which is explained the principles of the art, and, in this lesson no. 1, giving demonstration with the price curve of potatoes in U.S. 

The Adept - The American Journal of Astrology (V20 N10 Oct 1920 - V21 N9 Sep 1921) 

Saturday, January 12, 2013

Decennial Pattern for 2013

Larry R. Williams: The Right Stock at the Right Time, p. 11
In his book Tides and the Affairs of Men (1939), Edgar Lawrence Smith presented the idea of a ten-year stock market cycle. Smith's theory resulted from combining two other theories, Wesley Mitchell's 40-month cycle theory and the theory of seasonality. Combining these two periods, Smith theorized that there must be a ten-year, or 120-month, cycle. 

This would result from ten 12-month, annual cycles and three 40-month cycles coinciding every 10 years. When Smith investigated prices more closely, he found that indeed there appeared to be a price pattern in the stock market that had similar characteristics every ten years. This pattern has since been called the decennial pattern.

Smith used the final digit of each year's date to identify the year in his calculations. He termed the years 1881, 1891, 1901, etc., as the first years; 1882, 1892, etc. are the second; and so forth. 

"The 10-year cycle continues to repeat over and over, but the greatest advances and declines occur at the end of the 20-year and 30-year cycles, and again at the end of the 50-year and 60-year cycles, which are stronger than the others.

W.D. Gann (1954): Master Stock Market Course, p. 224