Reference:
Jeffrey A. Hirsch (Oct 03, 2023) @ X
See also:
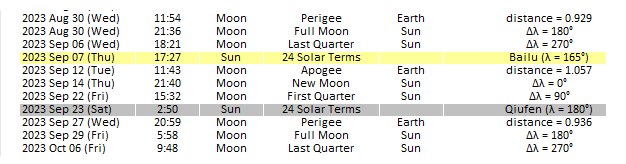
TPR (2023) - Chinese 24 Solar Terms & Lunar Cycles in 2023.
Jeffrey A. Hirsch (Oct 03, 2023) @ X
See also:
TPR (2023) - Chinese 24 Solar Terms & Lunar Cycles in 2023.


 |
| In 2023 the 15th trading day of June will be Wednesday, 21st - summer solstice. |
 |
| The Russell 2000 vs the major 118.12 Calendar Day SoLunar Cycle. |
 |
| Buy Rosh Hashanah, Sell Yom Kippur [evening of Friday , Sep 29] ? │ Jeff Hirsch |
 |
| DJIA, S&P 500 and NASDAQ Up 7 of Last 8 Years Day before Rosh Hashanah │ Jeff Hirsch |

 |
Almanacist | The UK Stock Market Almanac (Oct 12, 2016) - The 14 charts above show the performance of the FTSE All-Share index over the 12 months of a US presidential election year. For example, the first chart shows the January-December performance of the UK market in 1960, the year John Kennedy was elected President of the United States. The dashed line in each chart indicates the date of the election. However, "Trump is headed for a win", says Allan Lichtman, a distinguished professor of history at American University, who has predicted 30 years of presidential outcomes correctly (HERE) |
 |
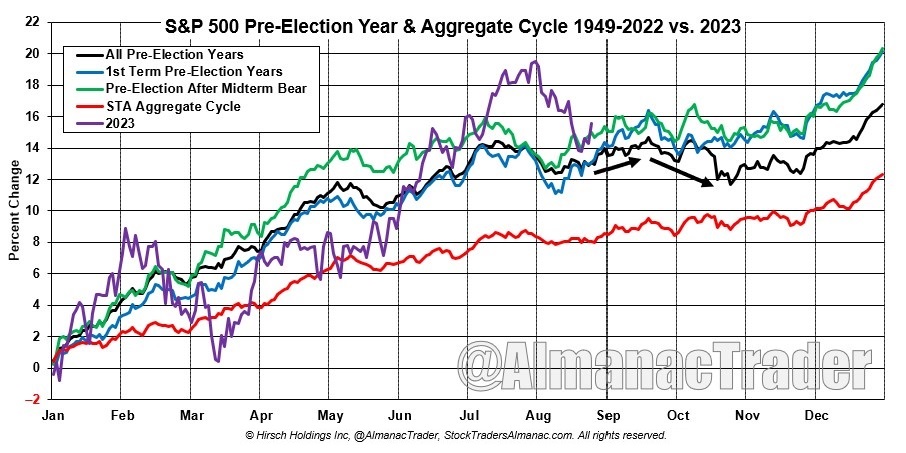
| 93 Trading Days ≈ 135 Calendar Days ≈ 19.3 Weeks ≈ 4.5 Months ≈ 0.37 Years. Regardless of the election outcome, in November and December the S&P 500 advances 72.2% of the time. (Source: Jeff Hirsch - see also HERE) |
 |
| Stan Harley: November 8 (Tue) = Cycle Low in Stocks + Crude Oil (HERE) |
 |
| Source: Jeff Hirsch's Almanac Trader |
 |
| Jeff Hirsch (Nov 25, 2015) - Now that Thanksgiving is upon us and early December gains tend to fade mid-month, consider closing out those short term longs into strength today, Friday and next week. |

 |
| Credits: Chris Carolan |
 |
| This could be an ending diagonal triangle developing up into the winter solstice to top around 2,165. Since 1987, the DJIA has logged gains in 22 of 28 years from the close on Friday after Thanksgiving to year end (HERE) |
 |
| However, the Nasdaq dropped only by -0.1% or -2.65 points on Nov 4 (Wed) while the RASI was still rising, and Thomas Bulkowski remarks: Since 02/05/1971 the Nasdaq made 541 similar moves on a percentage basis. After those moves, the next day's: Average gain was 0.7% on 295 occasions. Average loss was -0.9% on 246 occasions. Expect the index to close higher 54.5% [on Nov 5]. |

 |
| Tekkie Suresh: "Rahu getting involved with Venus and Mars, points to a trough around November mid month, Should see a recovery thereafter." |
 |
| Jeff Hirsch (Nov 3, 2015) - In the most recent 21-year period spanning 1994 to 2014, November opens strong, peaks around the fourth trading day, trades lower till the eighth trading day, bounces mid-month, moves sideway to down during the week before Thanksgiving then higher to close out the month with gains ranging from just under 1.5% for Russell 2000 to over 2% for DJIA. |

 |
| Credits: Jeff Hirsch |
 |
| Calculated and charted with Sergey Tarassov's Timing Solution. For the methodology see HERE |
 |
| www.sentimentrader.com |
 |
| www.stocktradersalmanac.com |


%20@%20X.jpg)