Showing posts with label Edward R. Dewey. Show all posts

Wednesday, December 13, 2023

The 41-Month Kitchin Cycle In Stocks │ Edward R. Dewey

Another cycle that has done all in its power to keep cycle scientists humble is one averaging 40.68 months in length. It has been present in industrial common-stock prices since 1871 and was discovered in 1912 by a New York group of investors. These gentlemen had learned that the Rothschilds had analyzed British consols (government obligations) and had broken up the price fluctuations into a series of repeating curves that had been combined and used for forecasting. The New York group hired a mathematician to discover the secret formula of the Rothschilds, and working with the Dow-Jones Railroad Averages, he discovered a forty-one-month cycle, plus three others, which his employers used to help them invest in the market. Apparently they were very successful around World War I.
 
Figure 38: The 41-Month Rhythm in Stock Prices, 1868-1945.
 
Some ten years after the original discovery, Professor W. L. Crum, of Harvard, noted a cycle of "39, 40, or 41 months" in monthly commercial-paper rates in New York. Almost simultaneously, Professor Joseph Kitchin, also of Harvard, discovered a cycle that he called forty months in six economic time series, bank clearings, commodity prices, and interest rates in both Great Britain and the United States from 1890 to 1922. As far as I know, it was not until 1935, twenty-three years after the original discovery, that this cycle was again noticed in the stock market. Our old friend Chapin Hoskins, who knew nothing of the earlier work, discovered this cycle in many series of price and production figures, including common-stock prices. Early in 1938 he made an extensive study of this cycle for one of the large investment-trust services.

Figure 38 shows the forty-one-month cycle (now refined to 40.68 months) from 1868 through 1945. As you can see, while its waves are not identical to an ideal 40.68 wave, which is represented by the broken zigzag, there is an amazing correspondence between them. This cycle persisted through wars and peace, good times and depressions.

Then, in 1946, something strange happened to our cycle. Almost as if some giant hand had reached down and pushed it, the cycle stumbled, and by the time it had regained its equilibrium it was marching completely out of step from the ideal cadence it had maintained for so many years. As you can see in Figure 39, it has regained the approximate beat of forty-one months or so, as before, but its behavior now appears upside down on our graph.
 
Figure 39: The 41-Month Rhythm, Upside Down, 1946-1957.
 
Scores of explanations and reams of paper have been expended to explain this behavior. We are familiar with most of the possibilities, such as distortion by random behavior, two or more other cycles of near lengths, and even a general public knowledge of this particular cycle, which may have had a distorting effect on its timing. But, in truth, no one can positively explain what happened in 1946 any more than they can explain the regularity of the rhythm for all the years that preceded it.

 
42-Month Cycle in the DJIA (weekly bars), March 2020 - October 2023.

Friday, October 21, 2022

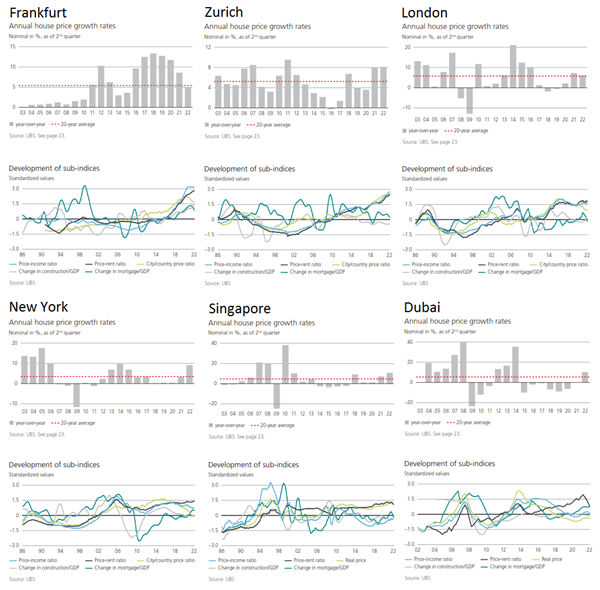
Global Real Estate Bubble Index 2022 | 18.6 Year Real Estate Cycle

UBS (Oct 11, 2022) - Nominal house price growth in the cities analyzed accelerated to 10% from mid-2021 to mid-2022, representing the highest increase since 2007. Four US cities — Miami, Los Angeles, San Francisco, and Boston — are among the top five with the fastest-growing prices.
 

Imbalances
are sky-high in both analyzed Canadian cities, with Toronto topping the index. Valuations in Frankfurt, Zurich, Munich, and Amsterdam also show elevated risks in Europe. In contrast, there is no bubble risk in the US cities. Since last year, mortgage rates have almost doubled on average across the cities analyzed. Alongside increased prices, this makes city housing much less affordable. A skilled service sector worker can afford roughly one-third less housing space than before the pandemic. 
 
 
In almost all cities, households have been leveraging up. Outstanding mortgages recorded the strongest increase since 2008. Debt-to-GDP is on the rise as well, reflecting the cheap financing conditions and weak economic growth since the pandemic. People have returned to the cities. Strong household formation and unaffordable owner-occupied housing drove demand for rental units. As a result, rents grew by 7% on average last year, making up all rental losses accumulated during the first year of pandemic. Higher interest rates, inflation, turmoil in the financial markets, and deteriorating economic conditions are putting the housing boom under pressure. In a majority of cities with high valuations, price corrections have either already begun, or are expected to start in the coming quarters [...] 

Edward R. Dewey & Edwin F. Dakin, 1947:
"No matter what index be used, this 18-year cycle rhythm seems one of the clearest,
most regular patterns revealed in our economic life.
"
 
In 1947 Edward R. Dewey and Edwin F. Dakin showed that 18.6 year real estate cycles have repeated over centuries: in times of inflation or deflation, whether interest rates are high or low, with or without trade barriers, with government subsidies, and with high, low or no taxes. Fred Harrison demonstrated considerable economic predictive power relating to this 18.6 year cycle pattern: 14 years up, interrupted by a mid-cycle dip, followed by 4 years down. In over two centuries, this cycle has only ever been disrupted by two world wars. The cycle has never been shorter than 17 years, or longer than 21.

Dewey and Dakin wrote: "The building cycle is so long that few people experience two complete cycles in their business life. Education, to be effective, must therefore be “book knowledge” rather than experience […] For many individuals, an unfavorable first experience means a lifetime tragedy […] The welfare of an individual is often determined by the time in which he was born. If he is old enough to start business at the low of a business cycle, which is accompanied by […] rising prices, his chances for success are very good. Conversely, if he is born at such a date that he starts in business at the peak of a building cycle, which is accompanied by falling commodity prices, his chances of success are small. Much of the success or failure of an individual is due to forces over which he has no control; but if he understands these forces, he may protect himself from the worst results of unfavorable combinations and profit personally from favorable combinations."
 
All cycles have the same characteristics, but different influences, and government intervention in markets cannot create or suppress the real estate cycles. Credit, created by banks, through fractional reserve banking, fuels the cycle. Each recession brings new rules and regulations to the banking industry, designed to stop problems and prevent abuses; each upturn brings new ways to profit by exploiting loopholes in those rules and regulations. 
 
Residential real estate is first to recover from a downturn. The mid-cycle slowdown is confusing: The 18-year cycle is so long that few people remember the last one, and when market expansion quickly resumes, people think everything is fine. But the coming downturn will always be much worse than a mid-cycle slowdown. In the final years of a cycle, authorities congratulate themselves on how well they are managing things. If banks know the government will bail them out, why be prudent in lending. Seeing huge returns of others, the masses rush into real estate investing, believing it never goes down until fear overtakes greed. Land values peak about 12-24 months before a recession. 
 
A peak in the building cycle usually follows peak in land values, but precedes the recession. Announcement of the next ‘world’s tallest building’ may well be the most reliable indicator of an approaching peak. Copper prices spike into the last years of each real estate cycle. In the US all recessions since 1960 have been preceded by an inverted yield curve. The turning point in a cycle is often the collapse, or near collapse, of a major bank; some event will arise to cause doubt, but you’ll hear assurances that everything is okay. 
 
The crisis at the end always comes in an environment of rising interest rates, and the stock market is first to trough because of its far greater liquidity. Investors, speculators, and homeowners with little equity at the end of a cycle will always be wiped out. Always. Recovery takes years, not months. Historically, prices have dropped 20-30% from previous peaks. In the US the 18.6 Year Real Estate Cycle is expected to peak and crash again around 2025 - 2026.
 
 
See also:

Friday, October 14, 2022

Periods When to Make Money | Benner Cycle Projection into 2023 Major Low

Samuel Benner was a prosperous American farmer wiped out financially by the 1873 panic and a hog cholera epidemic. In retirement, he set about to establish the causes and timing of fluctuations in the economy. 
 
Edward R. Dewey (1967):
» If you had used these dates for trading, your percentage gains between 1872 and 1939
would have been 50 times your losses!
«

In 1875 he published a book called
"Benner's prophecies of future ups and downs in prices" forecasting commodity prices for the period 1876 to 1904. Many - not all - of these forecasts were fairly accurate. The Benner Cycle includes:
  • A (upper line): "Years in which Panics have occurred and will occur again." A 54 year cycle alternating every 18, 20 and 16 years.
  • B (middle line): "Years of Good Times, High Prices and the time to sell Stocks and values of all kinds." Cycles alternating every 8, 9 and 10 years.
  • C (lower line): "Years of Hard Times, Low Prices, and a good time to buy Stocks, 'Corner Lots', Goods, etc, and hold till the 'Boom' reaches the years of good times; then unload". A 27 year cycle in pig iron prices with lows every 7, 11, 9 years and peaks in the order 8, 9, 10 years (B - middle line).
Benner's cycle projections align with the latest analysis of the "Foundation for the Study of Cycles" and are pointing to a major stock market low in the US in 2023. David Hickson's Hurst cycle analysis projects this low to March of 2023 and Martin Armstrong to April 11, 2023 (Tue).
 
» Periods When to Make Money « ; the original business card of George Tritch Hardware Co.
Apparently, the diagram was compiled by George Tritch in 1872, but was not attributed to
him by Samuel Benner in 1875.
 
References:
 

Sunday, October 1, 2017

George Marechal's Stock Market Forecast 1933 to 1948 │ Law of the Market

In 1933 the incoming U.S. President Franklin D. Roosevelt reached out to Roger Ward Babson for a long range forecast for the stock markets. Babson, a very successful entrepreneur, economist, business theorist, investor, and philantroph with a huge fortune, was a household name since he had predicted, back on September 5th 1929, that "a crash is coming, and it may be terrific". Later that very same day the stock market on Wall Street declined by 3% and this became known as the "Babson Break". The big crash with most catastrophic losses followed on October 24 and 29, 1929 (Black Thursday and Black Tuesday). When the U.S. finally reached the height of the Great Depression in 1932 and the stock market was at an all-time low, 75% of its value was wiped out, and shares in any company were virtually worthless. Thousands of people were ruined, and soup kitchens sprang up on street corners as people lost their jobs, savings and homes. 

To comply with President Roosevelt’s demand, Babson in turn consulted the largely unknown Canadian mathematician George Marechal, who recently had managed to work out how the highs and lows of the Dow Jones Industrial Index repeated themselves in predetermined sequences. So finally it was Marechal who produced a Dow Jones Index Forecast Chart over the next 15 years for the Roosevelt administration, that proved to be spectacularly accurate. So confident was Marechal in his prediction at the time that he had his chart copyrighted. His friend Alan H. Andrews (the inventor of Andrews’ Pitchfork) described it as a "chart no government economist, no college professor has enough knowledge to even approach or courage to try to duplicate.

Comparison of Marechal's 1933 forecast with actual data of the Dow Jones Index from 1934 through April 1951
[published by Garfield A. Drew and Edward R. Dewey in Cycles Magazine, October 1962].

Edward R. Dewey confirmed in 1962 that still little to nothing was known of Marechal's method, though a fund manager had offered him $20,000 for his secrets, or, alternatively, to operate a five million dollar fund on the basis of these secrets and to share profits. But Marechal did not accept either offer, and finally died at the age of 90 without ever revealing how he was able to calculate market movements with such uncanny accuracy. However, what is clear is that he was using a version of Babson's Normal Line. The annotations to his chart later added by his friend Alan Andrews show that Marechal plotted turns with what are now known as Median Lines. Dewey concluded:
"The important thing about this study [chart of Marechal] is not the exact precision by which it came true, or the amount of money you would or would not have made if you had followed it. The important thing is that it shows that the market has predictable patterns. In other words, that the seeming disorder of market fluctuations really is subject to law, and that this law is learnable."
In 1948 Garfield A. Drew, another friend of Marechal, reproduced the forecast in his book "New Methods For Profit in the Stock Market". Drew stated that one of the original copies of the forecast had been in his possession since 1935, and as each year was divided into six parts he added in his book the actual fluctuations of the Dow Jones Industrial Averages by plotting the high and low for each two-month period. Drew commented on the famous chart:
"Clearly, the pattern of the forecast and the actual pattern of the market miss many times in detail and exact timing. Nevertheless, the broad picture of the trends from 1934 through 1947, at least, is remarkably similar. The basic downtrend from 1936-37 to 1942 is plain, and likewise the uptrend from 1942 to 1946, although the latter shows up as a much more zigzag pattern in the forecast than was actually the case. Thus, the year 1944 by itself, for example, appears as a down period, whereas it was really an up year. When the year 1947 ended, the Dow Jones Industrial Average had spent 16 months within a 16% price range. As far as the situation at the time the comparison in [the figure] ends is concerned, it is evident that, if the broad accuracy of the preceding 14 years is to be maintained, 1948 must, on the whole, witness a rising price level. A definite down trend going substantially into new low territory by the year-end would produce a greater discrepancy between the forecast pattern and the actual course of prices than at any other time in the record. The fact remains to be seen at this writing, but, in line with his original forecast made years before, Marechal always insisted that 1946-47 was not a "bear market" but an interruption in a long upward trend comparable to the break and market hesitancy during 1926 in the long upswing from 1921 to 1929.
"In this figure the Dow Jones Averages are plotted from 1897 through 1962. On this chart are a number
of "resistance" lines. The original worksheets for Marechal's forecast look just about like this chart,
except that there were a great many more lines and, thus, a great many more intersecting points.
Marechal's secrets consist fundamentally of how to draw the resistance lines and how to select the
significant intersections"
[Edward R. Dewey in Cycles Magazine, October 1962].

Tuesday, February 28, 2017

The Skyscraper Indicator 1790 - 2015 │ Elliott Wave International


This market sentiment indicator has a reliable history that goes back nearly 200 years!
It's sending a signal today that's as clear as it's ever been.
Source: Elliott Wave International (Feb 27, 2017)
 
Cycles analyst Edward Dewey (1895-1978) was the chief economics analyst for the US Department of Commerce when he developed the "Skyscraper Indicator" in the 1940s: It correlates human optimism to the number of high-rise buildings under construction. When people are very optimistic, they tend to express their feelings in massive construction projects, especially very tall buildings, because they have a need to build toward the sky! Since this extreme optimism is reached at major market peaks, in the economy, severe economic downturns usually follow; not just declines in real estate prices. The world’s current tallest building, the Burj Khalifa in Dubai (828 m), nicely illustrates this process: It was built as a monument to the Gulf emirate’s boom in the middle years of last decade and opened in late 2009, just as the emirate plunged into financial crisis.

Experts note the 18-year financial cycle was disrupted by the First and Second World War,
but returned to its former state in 2006 (HERE)

It doesn't need a prophet to tell where the next bubbles are about to pop: Of all of the world's skyscrapers under construction, China is home to 53% of them and since 2016 China's highest buildings exceed the 'One World Trade Center' (417 m) in New York by 200 meters. The boom is on though in mid 2013 the construction of the planned 838 meter Sky City in south-central China was halted by the authorities for not having a building permission. A similar craze for high rise has gripped South Korea and India. India just finished building two skyscrapers and has 14 skyscrapers currently under construction. However, having survived the Arab Spring miraculously, it is this decrepit royal kleptocracy in Saudi Arabia that is now decorating Jeddah with a 1,007 meter high 'Kingdom Tower'. Let's have a look at what happened during recent high times in different places: The construction of the Taipei 101 (508 m) began in 1999 and was completed in 2004. The duration coincided without the recession in the early 2000s and the tech bubble while in 2010 the completion of the Burj Khalifa coincided with the current global financial crisis. The Asian economic crisis, currency devaluation and speculation in stock and property coincided in 1997-1998 with the completion of the Petronas Towers (452 m), the tallest buildings in the world at the time. Now the 18-Year Real Estate Cycle will again be due to peak and pop around 2016 (+/-). See also HERE

Source: The Visual Capitalist (Feb 11, 2016)

Wednesday, December 18, 2013

The Skyscraper Indicator | Excuse me, while I kiss the sky ...

Cycles analyst Edward Dewey (1895-1978) was the chief economics analyst for the US Department of Commerce when he developed the "Skyscraper Indicator" in the 1940s: It correlates human optimism to the number of high-rise buildings under construction. When people are very optimistic, they tend to express their feelings in massive construction projects, especially very tall buildings, because they have a need to build toward the sky! Since this extreme optimism is reached at major market peaks, in the economy, severe economic downturns usually follow; not just declines in real estate prices. 

The world’s current tallest building, the Burj Khalifa in Dubai (828 m), nicely illustrates this process: It was built as a monument to the Gulf emirate’s boom in the middle years of last decade and opened in late 2009, just as the emirate plunged into financial crisis. These are the highest buildings in 2013:

World's Tallest Buildings 2013

And these are the tallest buildings currently under construction and expected to be complete before 2020:

Skyscrapers under Construction

It doesn't need a prophet to tell where the next bubbles are about to pop: Of all of the world's skyscrapers under construction, China is home to 53% of them and by 2016 China's highest buildings will exceed the 'One World Trade Center' (417 m) in New York by 200 meters. The boom is on though in mid 2013 the construction of the planned 838 meter Sky City in south-central China was halted by the authorities for not having a building permission. A similar craze for high rise has gripped South Korea and India. India just finished building two skyscrapers and has 14 skyscrapers currently under construction. However, having survived the Arab Spring miraculously, it is this decrepit royal kleptocracy in Saudi Arabia that is now giving thanks to each other by decorating Jeddah with a 1,007 meter high 'Kingdom Tower'.

Let's have a look at what happened during recent high times in different places: The construction of the Taipei 101 (508 m) began in 1999 and was completed in 2004. The duration coincided without the recession in the early 2000s and the tech bubble while in 2010 the completion of the Burj Khalifa coincided with the current global financial crisis. The Asian economic crisis, currency devaluation and speculation in stock and property coincided in 1997-1998 with the completion of the Petronas Towers (452 m), the tallest buildings in the world at the time. Now the Great 18-Year Real Estate Cycle will again be due to peak and pop around 2016.