Define the Grinch Barometer as the S&Ps performa over the 3 trading days before and after Xmas (6 days). Stay tuned for Grinch spottings.

Since
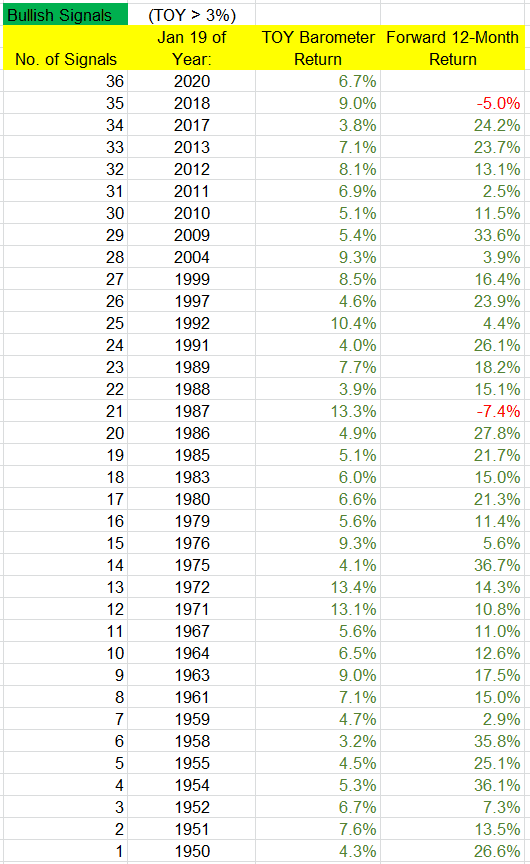
1950, a negative Grinch has been followed by a positive January in 16
of those 19 years (average month = +4.3%) and a positive calendar year
in 18 of those 19 cases (average year = +19.4%). To the contraire,
eleven of the 12 S&P double digit loss years since 1950 followed
positive Grinch’s.


S&P 500 McClellan Summation Index - the long-term version of the McClellan Oscillator -
kept steadily rising for six week and closed at 858 last Friday. No reversal.


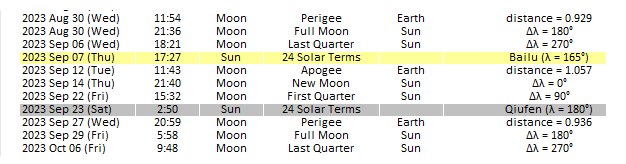
However, the DJIA now closed the sixth week / the 27th trading day above the 9-day moving average a.k.a. the market maker re-balance level within all different weekly range templates. Not sure when this happened last time. All the shallow consolidations during the past four weeks occurred around the 3-day moving average only. Spectacular. Meanwhile the S&P 500 and the NASDAQ consolidated last week around the 9 DMA into Thursday before taking out the previous weeks high once again - but by some points only. Nasdaq actually printed lower weekly lows and closed on a lower high. What goes up will come down again to 50%+ levels - sooner or later. Next Monday, December 11, the DJIA will open the seventh week / the 28th trading day above the 9 DMA. Impressive outside fourth quarter range on a new 2023 high. The S&P 500 touched the July 27 yearly high to the pip but did not break to the upside. Lagging behind the other two major indexes by at least a single pip. Quite fantastic. Monday, December 10, will be 45 solar longitude degrees away from the November 27 major low. Tuesday, December 12 looks like a New Moon and 'Sensitive Solar Degree' December high. Saturday-Sunday, December 16-17 is a turn day in the geocentric Bradley Siderograph and should mark a low in US stocks.
.png)


%20@%20X.jpg)


%20-%20AstroStats%20for%20the%20NYSE%20103%20p.%20.pdf.png)