Showing posts with label ICT. Show all posts

Wednesday, November 29, 2023

Wednesday, October 4, 2023

The Weekly Opening Range & ICT Weekly Range Profiles

The Weekly Opening Range is defined by Monday's range. Monday sets the Opening Range high and low for the entire week. Tuesday may extend that range. It could become a false break, a break and range extension, a reversal, or maybe an inside day. In a large majority of weeks, by the time Monday and Tuesday has traded, the high or low extreme is in place for the week, and one of these will tend to hold, the other may get broken.  
 

After Monday's Weekly Opening Range only three things can happen on Tuesday:
  1. A Breakout from a Opening Range and Trend.
  2. A Breakout from a Opening Range and Reverse into the Opening Range (false breakout or stop hunt).
  3. A Trading Range between Highs and Lows of the Opening Range (inside day).
Coming into Wednesday, look for the following:
  • Did Monday or Tuesday close as an inside day?
  • Did Tuesday's breakout fail?
  • Did Tuesday close outside of Monday's Opening Range (= Opening Range Breakout) or inside?
  • Was Tuesday a First Red Day (FRD) or a First Green Day (FGD)?
  • Has there already been 3 levels of rise or fall from the High or the Low of the Week (LOW/HOW)? This could indicate a daily reversal.
  • Consider market structure! 


Here are some additional observations related to whether Wednesday will be a reversal or a trend continuation of the Monday-Tuesday initial balance:
  • If the market closes outside of Monday's Opening Range on Tuesday, the probability that Wednesday continues the trend increases significantly (unless the breakout fails on Wednesday)
  • On Tuesday the market breaks out of Monday's range, but pulls back and closes inside of  Monday's range (failed breakout). The probability of reaching for the other end of the Opening Range increases significantly.
  • If Monday's breakout fails, and Tuesday's breakout also fails at the other end of Monday's range, there is  high potential for a Parabolic Trend Trade on Wednesday.
  • 3 Pushes of drives out of the Weekly Opening Range coming into Friday has the highest potential for a large reversal.
  • If there are only 2 drives out of the Opening Range coming into Friday, there is a higher probability for a Parabolic Trend Trade.
  • If the breakout on Tuesday closes 3 levels of rise or fall out of the Opening Range, the potential for reversal throughout the week increases.
  • In most instruments the Tuesday-Friday range extension from Monday's opening range is usually a multiple of 0.5, 1.0, 1.5, 2, 3, 4 or 5 of Monday's range.
  • In most instruments the Average Weekly Range equals 1.8 to 2.3 times the Average Daily Range. 
 
Time Frames - Price Ranges - Time-Price Proportions | Some Observations
 
References:

Sunday, October 1, 2023

The ‘ICT Power Of 3’ Concept & ‘ICT Killzones’ | Rounak Agarwal

The ‘ICT Power Of 3’ concept is a key component of any trading strategy or model developed by Michael J. Huddleston a.k.a. 'The Inner Circle Trader' (ICT), and explained as under:
 
1. Typical Bullish Day
 
Figure 1
 
Price will go below the opening price at midnight [all times refer to New York local time] to lure retail traders into going short. This is the ‘accumulation phase’ where smart money traders (SMT) will buy the shorts placed by retail traders. Then, price will rally higher to take out ‘liquidity’, which is called the ‘manipulation phase’, during which SMT will either hold or sell a portion of their positions. Eventually, price will retrace and become range-bound in an area near the high of day and close near the high, known as the ‘distribution phase’, where SMT will sell the remaining positions to retail traders willing to go short.

2. Typical Bearish Day
 
Figure 2
 
Price will go above the opening price at midnight to lure retail traders into going long. This is the ‘accumulation phase’ where smart money traders will sell the buy orders placed by retail traders. Then, price will rally lower to take out ‘liquidity’, which is called the ‘manipulation phase’, during which SMT will either hold or square off a portion of their positions. Eventually, price will retrace and become range-bound in an area near the low of day and close near the low, known as the ‘distribution phase’, where SMT will square off the remaining positions to retail traders willing to go long.

3. Typical Bullish Week
 
Figure 3
 
Price will go below the opening price at Sunday’s opening to lure retail traders into going short. This is the ‘accumulation phase’ where smart money traders will buy the shorts placed by retail traders. Then, price will rally higher to take out ‘liquidity’, which is called the ‘manipulation phase’, during which SMT will either hold or sell a portion of their positions. Eventually, price will retrace and become range-bound in an area near the weekly high and close near the high, known as the ‘distribution phase’, where SMT will sell the remaining positions to retail traders willing to go short.

4. Typical Bearish Week
 
Figure 4
 
Price will go above the opening price at Sunday’s opening to lure retail traders into going long. This is the ‘accumulation phase’ where smart money traders will sell the buy orders placed by retail traders. Then, price will rally lower to take out ‘liquidity’, which is called the ‘manipulation phase’, during which SMT will either hold or square off a portion of their positions. Eventually, price will retrace and become range-bound in an area near the weekly low and close near the low, known as the ‘distribution phase’, where SMT will square off the remaining positions to retail traders willing to go long.

Another technical analysis concept from Michael J. Huddleston is ‘ICT Killzones’, which are the highest probability time-ranges for price to make big moves in the markets. This is an integral part of ‘ICT Power Of 3’ and both are to be used in conjunction to see the markets like the ICT. The researcher has dealt only with two of ‘ICT Killzones’ here, which are:
  1. ICT London Open Killzone – 02:00 to 05:00 New York local time
  2. ICT New York Open Killzone – 07:00 to 10:00 New York local time which is extendable to 11:00 due to release of important economic reports, news, Fed chairperson speeches, etc. scheduled at 10:00.
Some important things to bear in mind:
  1. The researcher has considered market state to be bullish if the amount of difference from open to low is less than open to high. Similarly, market state is bearish if the amount of difference from open to low is more than open to high. Days and weeks with neutral market state, i.e., where the amount of difference from open to low was equal to the amount of difference from open to high, were omitted. They were very few and the researcher believes that the omission did not affect the findings to a significant degree.
  2. Sunday was omitted in calculation of average daily movement and average hourly movement for each pair to prevent inconsistencies. For the same reason, it was not considered in finding out frequency of days when price made high/low of bearish/bullish week.
  3. All time ranges, etc. have been considered in the form of New York local time, adjusted for Daylight Savings Time (DST).
  4. Average Daily Movement – It is the average of the daily ranges (low to high) of that particular year.
  5. Average Weekly Movement – It is the average of the weekly ranges (low to high) of that particular year.
  6. Average Daily Movement during ‘Accumulation phase’ – It is the average range of the ‘accumulation phase’ (open to high/low) of ‘bearish’/’bullish’ days of that particular year.
  7. Average Weekly Movement during ‘Accumulation phase’ – It is the average range of the ‘accumulation phase’ (open to high/low) of ‘bearish’/’bullish’ weeks of that particular year.
  8. SMT – ICT terms smart money traders as ‘SMT’. These traders know how to keep themselves in line with the algorithm and profit from trading. On the other hand, retail traders, according to Michael J. Huddleston, are those who are not trading but ‘gambling’. These ‘traders’ do not have an understanding of the market which they can rely upon and not hop from strategy to strategy, indicator to indicator instead.
  9. ‘ICT Killzones’ has been shown only in Figure 1 to serve as an example. The explanation provided with Figure 4 does not comply completely with the figure, and it is because ICT’s concepts are not fixed rules. Also, the main idea has not been invalidated, as we can see in the figure that the low of the week formed after the week’s high was formed.
Quoted from:
technical analysis concept (ICT Power Of 3) in the foreign exchange market.
 
See also:

Saturday, September 30, 2023

ICT Liquidity - The Financial Market's Zero Sum Game | Michael J. Huddleston

For a trader or institution to buy or sell an instrument, stock, currency pair, etc. it is necessary that there is another trader or institution or 'the crowd' with the equivalent opposite position. If the smart money (capital controlled by institutional investors, market mavens, central banks, funds, and other financial professionals) wants to buy a financial instrument, they will need sellers in the market. Our presumptions are: 
  1. All financial markets are a zero sum game. 
  2. In all financial markets price is generated and driven by the market maker's auction algorithm. 
  3. The market maker's price generating algorithm continuously calculates, re-balances and manages the flow of orders always in line with the fundamental 'Minimum of 50% Retracement-Rule across all time-frames: fractions of a second, minutes, hours, days, weeks, months and quarters. 
  4. The algorithm generates the mathematically highest possible return for the market maker.

 
For the market makers, for the big dealers in the exchanges - for the smart money - liquidity is provided by the dump money, by the crowd, at levels where the dump money usually has its Stop loss, Buy and Sell orders. Driving price beyond these order-levels, the market maker collects liquidity - the money of the uninformed. Smart money activates these stop, buy and sell orders to feed and place their contrary positions in the market. Richard D. Wyckoff - a brilliant speculator, and later on a broker and market maker himself - explained the accumulation and distribution process of the 'market maker' - of the Composite Operator - in all detail ninety years ago. The Composite Operator manipulates the price in order to collect 'free money'. Liquidity.  
 
There are two types of liquidity:

1.          Buy Stops Liquidity (BSL)
The BSL is originated by Stop Losses of sell orders, after the BSL is taken, the market reverses to the downside, because banks use the BSL to place sell orders in the market. 
 
 
Regarding Buy Stops Liquidity (BSL) focus on:
PMH - Previous Month's High
PWH - Previous Week's High
PDH - Previous Day's High
HOD - High Of Day
OLD HIGH - Swing High
EQUAL HIGHS = Retail Traders' typical 'Resistance'.

When BSL is taken, the market reverses to the downside.
 

2.          Sell Stops Liquidity (SSL)
The SSL is originated by Stop Losses of Buy orders, after the SSL is taken, the market reverses to the Upside, because banks use the SSL to place Buy orders in the market. 
 
 
Regarding Sell Stops Liquidity (SSL) focus on:
PML - Previous Month's Low
PWL - Previous Week's Low
PDL - Previous Day's Low
LOD - Low Of Day
OLD LOW - Swing Low
EQUAL LOWS = Retail Traders' typical 'Support'.

When SSL is taken, the market reverses to the upside.
 

The Stop Hunt (SH) is a manipulation movement used by the Market Makers to neutralize liquidity (stop losses). It's a false breakout above /below the zone where there is liquidity. Market Makers usually use High Impact News to take liquidity.
 
High Impact News Calendar

Always pay attention to the news calendar, to know the pairs that will move, generally, pairs with many news forecasts('High Impact'), those currency pairs, stocks, bonds, etc. are going to move (trending) during the day or week.

See also:

Tuesday, June 20, 2023

ICT Daily Range Profiles | Michael J. Huddleston

1. The Classic Buy Day or Sell Day Template
This is the best template to make money since it is a wide range trending day that unfolds mostly on Monday, Tuesday and latest on Wednesday during the London session. The New York session will eventually give a retracement to continue with the trend that was set during the London session. The daily range will last for 7 to 8 hours once the profile is established.
 

Mostly it will give a rally or drop from the daily opening price to the low or high of the day during the London session. The trend usually lasts into 11:00 EST.
 
2. The London Swing to Z Day Template
This template is found in the middle of a larger price swing when the trend is exhausted after a large explosive move. It is a narrow range day and ideally occurs on Thursday. 


Price will initially drop below the opening price, then run above the opening price and go back to the range into consolidation. It first appears to unfold as the Classic Buy or Sell Template. But if it continues consolidating, do not look for continuation into the New York session. Take profits.
 
3. The London Swing to New York Open / London Close Reversal Template
The bullish version of this template always begins like a Classic Buy or Sell template with a decline below the opening price before price starts rallying. Once price drops, a buy entry forms, price rallies to a higher time frame Point of Interest (POI). If this happens during the New York session, it indicates a classic market reversal. 


The template is used to either reach for a bearish order block on a higher time frame, for a turtle soup raid or to close a range. On a bullish day it will first create an initial low of the day during the London session, run up and create the high of the day during the New York session around the London Close, then run back down and clear the initial low that was created during the London session. Ideally it can pan out after the market is in exhaustion based on the higher time frame's dominant trend.
 
4. The Range to New York Open / London Close Rally Template
Generally this template is to be expected on days with high or medium impact news events like interest rate announcements, etc. Ahead of these events price will remain in consolidation during the Asian and London sessions. Lows will be cleared initially and after the news price explodes into a directional move.
 
  
5. The Consolidation Raid on News Release Template
Unfolding during the New York session on days with high impact news, mostly FOMC press releases. During and shortly after the news old highs and lows of prior consolidation levels will be taken out. Ideally buy when a low is taken out and sell when a prior high was breached.
 
 
 6. The London Swing to Seek & Destroy Template
This is the kind of day that won’t make you money. The Market Makers clear intention is to take out both buyers and sellers. Initially it would give you a London Open opportunity and setup, but very likely that won’t come to fruition. The narrow range zig-zag template lasts throughout the New York session and will oftentimes create an inside day. The template is usually applied in the middle or at the end of a larger price swing. 


Wednesday, April 5, 2023

ICT Weekly Range Profiles | Michael J. Huddleston


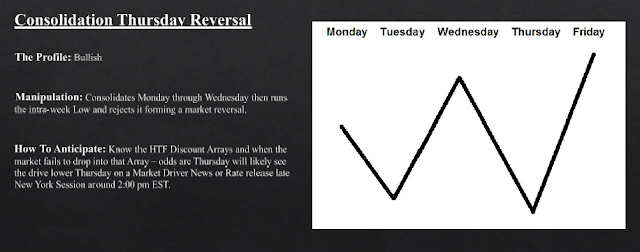
These profiles are conceptual models that describe typical patterns in how prices might behave during a trading week. Each profile has unique characteristics that can guide traders in anticipating potential market movements. However, it’s important to note that these profiles are not rigid predictions but rather frameworks to understand market tendencies. 
 
The weekly price movement in financial markets follows a recurring pattern of consolidation, expansion, reversal, expansion again, consolidation, and a potential reverse or retracement:
  1. Sunday Open Consolidation: The week often begins with price consolidation on the Sunday open, reflecting a cautious approach as traders assess the weekend developments.
  2. Monday Expansion: As the trading week gains momentum, Monday is typically marked by an expansion phase. This reflects increased activity and movement as traders react to new information.
  3. Tuesday Reversal: The following day, Tuesday, often witnesses a reversal in price trends. This can be attributed to traders reassessing their positions after the initial expansion phase.
  4. Wednesday Expansion: Midweek, the market tends to experience another expansion phase. This reflects a renewed bout of activity and movement in response to evolving market dynamics.
  5. Thursday Consolidation: On Thursday, there’s often a consolidation phase. Price ranges may narrow as traders assess the overall sentiment and prepare for the end of the trading week.
  6. Midweek Friday Reverse or Retrace: As the week approaches its close, Friday may see a reversal or retracement in trends. Traders might adjust their positions before the weekend, leading to a shift in price direction.

This weekly cycle reflects the rhythm of market sentiment and participant actions throughout the trading week.