Showing posts with label Financial Astrology. Show all posts

Friday, March 1, 2024

Planetary Harmonics | Larry Berg

 
» The heavenly motions are nothing but a continuous song for several voices, to be perceived by the intellect, not by the ear; a music which, through discordant tensions, through syncopations and cadenzas as it were, progresses toward certain predesigned six-voiced cadences, and thereby sets landmarks in the immeasureable flow of time. « 

— Johannes Kepler, 1619, The Harmony of the Universe, Book V, Chapter 7. 


See also:

Thursday, January 11, 2024

Cosmic Cluster Days | January - February 2024


Heliocentric and geocentric angles between planets coincide with Change in Trend (CIT) in financial markets. 
Cosmic Cluster CIT-Signal Days = Composite Line of all angles outside the Cosmic Noise Channel.
Cosmic Cluster CIT-Signal Days (CCDs) have no consistent polarity/directional bias.
Swing highs and lows  of the Composite Line  inside of the channel may also coincide with market reversals.
= White Circles = Full Moons | = Black Circles = New Moons.
 The calculation methodology of the Composite Line  is akin to the one of the Berg-Timer.
 
Recent and upcoming Cosmic Cluster CIT-Signal Days are: 

Dec 06 (Wed)
Jan 08 (Mon)
Jan 27 (Sat)
Jan 31 (Wed)
Feb 04 (Sun)
Feb 17 (Sat)
Feb 22 (Thu)
Feb 25 (Sun)
Feb 29 (Thu)
Mar 02 (Sat) - Mar 03 (Sun) - Mar 04 (Mon)
 
Solunar Rhythm in January 2024. 
 
In Bull Markets, New Moons are Bottoms, and Full Moons are Tops. 
In Bear Markets, New Moons are Tops, and Full Moons are Bottoms. 
 
(Source: Rob Handler, 2024)
 
 More often than not, stocks will 
 rise from (+/-) the 7th to (+/-) the 14th calendar day of a month.,
fall from (+/-) the 14th to (+/-) the 20th,
and rise from (+/-) the 20th to (+/-) the 25th.
 
 The 4th, 6th, 10th, 14th and 18th are usually positive.
The 7th and 20th are usually negative.
Not enough data for the 30th.

 
(Source: Rob Handler, 2024)

(Allen Reminick, Jan 12, 2024)

Monday, January 8, 2024

S&P 500 Index vs 18.61 Year Lunar Node Cycle │ January 2024


» The lunar node, quite abstractly speaking, is the point of intersection of the solar and the lunar orbits. There are, therefore, two nodes in opposite positions in the heavens: an ascending node or lunar north node, and a descending node - the lunar south node. The solar and the lunar orbits are not, in effect, in the same but in different planes, enclosing a certain angle. Thus there arise the two opposite points of intersection. The peculiarity of these two points of intersection is that they do not stand still but slowly move. The plane of the lunar path rotates in relation to the plane of the solar path; so the two nodes move a round. They move around the Zodiac in a contrary direction to the rotation of the planets, i.e., from Aries backward through Pisces, Aquarius, etc. A complete revolution of a lunar node takes place in 18 years and 7 months; after this time, therefore, the node — the ascending node, for example — is once again in the same position in the Zodiac as it was before. The ascending node is, thereby, the mathematical point that (at any given time and again after 18 years and 7 months [= 6,798.383 CD] the lunar orbit rises above the solar orbit, while at the opposite point the descending node sinks below it. «

Willi O. Sucher, 1937.
 

Thursday, December 21, 2023

S&P 500 Index vs 18.61 Year Lunar Node Cycle │ Projection into April 2024

 
Dec 21, 2023 (Thu) = May 10, 2005 (Tue)
 
 
 In bull markets, New Moons are bottoms, and Full Moons are tops. 

Jan 3 (Wed) 22:30 = 270°
= Last Quarter    
Jan 11 (Thu) 06:57 = 0° = New Moon    
Jan 17 (Wed) 22:52 = 90° = First Quarter    
Jan 25 (Thu) 12:53 = 180° = Full Moon    

Tuesday, December 12, 2023

Sensitive Degrees of the Sun for the NYSE in 2024 | Jack Gillen


Date Sun's Longitude Position Effect on US Stock Indexes
     
2023 12 08 (Fri) = SUN @ 16 SAG = 256 degrees negative = low
2023 12 12 (Tue) = SUN @ 20 SAG = 260 degrees negative
2023 12 16 (Sat) = SUN @ 24 SAG = 264 degrees positive = high
2023 12 28 (Thu) = SUN @ 6 CAP = 276 degrees positive
2024 01 02 (Tue) = SUN @ 11 CAP = 281 degrees positive
2024 01 06 (Sat) = SUN @ 16 CAP = 286 degrees negative
2024 01 19 (Fri) = SUN @ 29 CAP = 299 degrees negative
2024 01 30 (Tue) = SUN @ 10 AQU = 310 degrees positive
2024 02 03 (Sat) = SUN @ 14 AQU = 314 degrees positive
2024 02 06 (Tue) = SUN @ 17 AQU = 317 degrees negative
2024 02 18 (Sun) = SUN @ 29 AQU = 329 degrees negative
2024 02 23 (Fri) = SUN @ 4 PIS = 334 degrees negative
2024 02 24 (Sat) = SUN @ 5 PIS = 335 degrees negative
2024 03 03 (Sun) = SUN @ 13 PIS = 343 degrees positive
2024 03 11 (Mon) = SUN @ 21 PIS = 351 degrees positive
2024 03 24 (Sun) = SUN @ 4 ARI = 4 degrees positive
2024 03 31 (Sun) = SUN @ 11 ARI = 11 degrees positive
2024 04 07 (Sun) = SUN @ 18 ARI = 18 degrees negative
2024 04 13 (Sat) = SUN @ 24 ARI = 24 degrees negative
2024 04 26 (Fri) = SUN @ 6 TAU = 36 degrees negative
2024 05 01 (Wed) = SUN @ 12 TAU = 42 degrees neutral
2024 05 08 (Wed) = SUN @ 18 TAU = 48 degrees negative
2024 05 19 (Sun) = SUN @ 19 TAU = 59 degrees neutral
2024 05 25 (Sat) = SUN @ 5 GEM = 65 degrees negative
2024 06 06 (Thu) = SUN @ 16 GEM = 76 degrees neutral
2024 06 07 (Fri) = SUN @ 17 GEM = 77 degrees negative
2024 06 08 (Sat) = SUN @ 18 GEM = 78 degrees neutral
2024 06 29 (Sat) = SUN @ 8 CAN = 98 degrees positive
2024 07 04 (Thu) = SUN @ 13 CAN = 103 degrees negative
2024 07 07 (Sun) = SUN @ 16 CAN = 106 degrees positive
2024 07 10 (Wed) = SUN @ 18 CAN = 108 degrees negative
2024 07 24 (Wed) = SUN @ 2 LEO = 122 degrees negative
2024 07 29 (Mon) = SUN @ 6 LEO = 126 degrees positive
2024 08 09 (Fri) = SUN @ 17 LEO = 137 degrees negative
2024 08 10 (Sat) = SUN @ 18 LEO = 138 degrees positive
2024 09 02 (Mon) = SUN @ 10 VIR = 160 degrees negative
2024 09 04 (Wed) = SUN @ 12 VIR = 162 degrees positive
2024 09 05 (Thu) = SUN @ 13 VIR = 163 degrees negative
2024 09 20 (Fri) = SUN @ 28 VIR = 178 degrees positive
2024 09 24 (Tue) = SUN @ 2 LIB = 182 degrees negative
2024 10 07 (Mon) = SUN @ 14 LIB = 194 degrees negative
2024 10 14 (Mon) = SUN @ 21 LIB = 201 degrees positive
2024 10 22 (Tue) = SUN @ 29 LIB = 209 degrees positive
2024 10 25 (Fri) = SUN @ 2 SCO = 212 degrees negative
2024 10 27 (Sun) = SUN @ 4 SCO = 214 degrees negative
2024 11 03 (Sun) = SUN @ 11 SCO = 221 degrees positive
2024 11 21 (Thu) = SUN @ 29 SCO = 239 degrees positive
2024 11 25 (Mon) = SUN @ 3 SAG = 243 degrees positive
2024 12 08 (Sun) = SUN @ 16 SAG = 256 degrees negative
2024 12 12 (Thu) = SUN @ 20 SAG = 260 degrees negative
2024 12 15 (Sun) = SUN @ 24 SAG = 264 degrees positive
2024 12 27 (Fri) = SUN @ 6 CAP = 276 degrees positive
2025 01 01 (Wed) = SUN @ 11 CAP = 281 degrees positive
2025 01 06 (Mon) = SUN @ 16 CAP = 286 degrees negative
2025 01 19 (Sun) = SUN @ 29 CAP = 299 degrees negative
2025 01 30 (Thu) = SUN @ 10 AQU = 310 degrees positive
2025 02 03 (Mon) = SUN @ 14 AQU = 314 degrees positive
 
 
» The Sun's position by itself in relation to the stock market can show you trends that are more or less active for each year,
as the sun degrees are generally fixed. They fall on about the same date every year. 
So this is why some periods of the year would be more of a pattern. «
 
Quoted from:
 Solar Ephemeris.

Monday, December 11, 2023

The Geocentric Bradley Barometer │ Turning Points 2024


2023 Nov 13 (Mon) = High
2023 Dec 17 (Sun) = Low
2023 Dec 22 (Fri) = High
2024 Jan 04 (Thu) = Low
2024 Jan 13 (Sat) = High
2024 Jan 22 (Mon) = Low
2024 Jan 29 (Mon) = High
2024 Feb 09 (Fri) = Low
2024 Feb 13 (Tue) = High
2024 Feb 25 (Sun) = Low
2024 May 26 (Sun) = High
2024 Jun 11 (Tue) = Low
2024 Jun 29 (Sat) = High
2024 Aug 19 (Mon) = Low
2024 Aug 29 (Thu) = High
2024 Sep 07 (Sat) = Low
2024 Sep 14 (Sat) = High
2024 Sep 19 (Thu) = Low
2024 Sep 27 (Fri) = High
2024 Oct 01 (Tue) = Low
2024 Oct 05 (Sat) = High
2024 Oct 27 (Sun) = Low
2024 Nov 02 (Sat) = High
2024 Nov 13 (Wed) = Low
2024 Nov 25 (Mon) = High
2024 Dec 08 (Sun) = Low
2024 Dec 18 (Wed) = High
2024 Dec 26 (Thu) = Low

[ calculated and charted for New York City (EST / EDT) with Timing Solution ]

The very well‐known financial astrology indicator known as the Bradley Barometer [or Bradley Siderograph] was created by Donald Bradley in 1947. The theory was that what is happening up in the sky affects human behavior on earth, so Bradley created a barometer that was a combination of transits. By assigning positive values to positive transits and negative values to negative transits he created a weighted net sum oscillator graph. The Bradley also includes the declination of planets. The higher in the sky that a planet appears above the horizon, the more positive the value. The lower in the sky that a planet appears below the horizon, the more negative the value. This Bradley Barometer graph correlated well to the markets even though there was no known physical correlation. The Bradley does very well in forecasting the headwinds or tailwinds of long‐term market moves that can occur over many months […] In recent years, it has shown quite a number of failures. This may be due to a variety of factors. If the Bradley Barometer measures the natural organic flow of the market, then there are certainly external artificial influences that can diminish its effectiveness. Some of these factors may include high‐frequency trading and/or government interference through central bank stimulus. Artificial inflation will cause a market to rise regardless of transits. The market will still oscillate, but with an upward bias. Another important angle to consider about the Bradley is that it designed to be taken in the context of what is happening in the market. The Bradley Barometer is an oscillator. We all know that the market does not oscillate back and forth all the time.

Over the past century, the market has trended higher. However, in between, there are cyclical bull markets and bear markets and sometimes there are consolidation periods. Everything forecast must be taken in its relative context to current market conditions. In a bull market, the down periods in the Bradley may simply mark sideways consolidation periods. It is useful to think of negative planetary transits in the face of a bull market as being nothing more than headwinds that are just a pause in the uptrend. It also follows that in a bull market the periods of the Bradley may mark the largest bull runs. In bear markets, the positive runs in the Bradley model serve as just pauses in the selling. The negative drops in the Bradley mark periods of intense selling in the market. In neutral markets, the Bradley tends to mirror market movement like an oscillator. nevertheless, the Bradley is a very popular model to this day, and many financial astrologers still use it as a backbone to get an overall picture of what the market is doing or what it made do in the future.

 
ooo0ooo
 
Also consider:
New Moons typically mark beginnings of cycles, and Full Moons mark completions. 
In bull markets, New Moons are bottoms, and Full Moons are tops. 
In bear markets, New Moons are tops, and Full Moons are bottoms. 
More often than not, stocks will rise from around the 7th to around the 14th calendar day of a month, 
fall from the 14th to the 20th, and rise from the 20th to the 25th.
Major Red News Releases (NFP, CPI, PPI, PMI, FOMC etc.) and Options Expiration Dates (especially Quad and Triple Witching)
may delay or cancel typical cyclical market behavior and astro signals.

Friday, December 8, 2023

Jack Gillen's Sensitive Degrees of the Sun | December 2023

 
» The Sun's position by itself in relation to the stock market can show you trends that are more or less active for each year,
as the sun degrees are generally fixed. They fall on about the same date every year. 
So this is why some periods of the year would be more of a pattern. «
 
Quoted from:
 
2023 12 08 (Fri) = SUN @ 16° SAG
2023 12 12 (Tue) = SUN @ 20° SAG = New Moon
2023 12 16 (Sat) = SUN @ 24° SAG
2023 12 28 (Thu) = SUN @ 06° CAP
2024 01 02 (Tue) = Sun @ 11° CAP 

 Solar Ephemeris.

Friday, September 8, 2023

Cycles Write World History | Donald A. Bradley

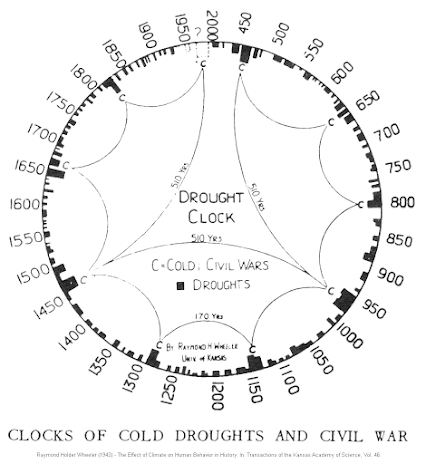
Research embracing many fields of scientific pursuit and all available historical records proves that the climate of the earth as a whole goes through long cycles. World-climate shifts from cold to warm periods and from wet to dry periods with amazing regularity. Dry periods accompanied by colder weather take place about every 170 years, every third such “cold drought” being severe in its effects.

"The turning points between old and new civilizations occur when 
cold-dry times reach their maximum severity."

Professor Raymond H. Wheeler, eminent psychologist of the University of Kansas, heads this study project which finds an important correlation between world climate and political history. Dr. Wheeler's analysis of an immense accumulation of data shows that great international changes occur on these shifts from warm to cold and vice versa. Nations deteriorate on the shift from warm to cold, the study reveals. What is probably most fascinating among the findings is that totalitarianism is representative of world-wide political sentiment during warm periods. Democracy is vivified and sought after by men during cold periods. Intervals of cold droughts usually coincide with eras of civil wars. International wars are fought, for the most part, during warmer times. The Wheeler project has identified basic mass-psychological patterns with every climatic condition found in the global weather cycle. Public attitudes and popular ideas are directly colored by the general nature of the world-climate prevailing at any time.
 
Raymond H. Wheeler and his 'big book'.
 
Astrology offers a logical explanation for this 170-year rhythm in world activities. It is hardly a coincidence that every cold-drought is synchronized with one of the solar system's major planetary configurations. Called a great mutation in astrological parlance, a conjunction of the planets Uranus and Neptune occurs every 171 years, on the average. These conjunctions are within effective orb for 15 years before and after their central date of coming-together in the sky. This Uranus-Neptune cycle leaves a continuous impression on the unwinding scroll of world history in inciting those conditions in human and natural affairs described.

Central conjunctions of Uranus and Neptune took place in the A.D. years of 
110, 281, 453, 624, 796, 967, 1139, 1310, 1481, 1653 and 1824 [1906-10, 1993, 2078-81, 2165]

[The years cited mark the general centers of the 30-year influence at work. They are computed for the conjunctions in mean heliocentric longitude, and not for the apparent (geocentric) times of occurrence. The time-margin allowed for this difference is nearly a whole decade.]

Each of these epochs is at or near the dead center of a period of serious cold drought recorded in the annals of history and science. It is no surprise to the astrologer that lowered mean temperature, lack of much rainfall, political stress and civil war itself should be typical of our earth’s response to these vibrations. Uranian influences alone have long been recognized as revolutionary in action. Neptune is peculiarly associated with meteorological matters, and also with canons of idealistic thought. Astrologers are generally agreed that Neptune is the planet of “isms” and ideologies which provoke national and international changes of attitude. Uranus is disruptive in action and progressive in the long run. Neptune, on the other hand, is said to determine world sentiments which have an emotional base. Conjunctions of these divergent forces bring about the years of famine and civil strife which make and break the great economic and political structures we call nations.

The primary precipitation-and-temperature cycle is obviously connected with a particular interplanetary periodicity. There are dozens if not hundreds of other cycles in man’s social and natural environment which can be traced to similar causes. Relations of two or more planets to each other as viewed from the earth are called aspects. The positions of any moving heavenly body across the great star-sprangled backdrop of the sky are called transits. In astrology, we make use of the term transit to mean the location of a planet by the sign of the zodiac it occupies. Aspects and sign-transits of the various planets are the fundamental causes of cycles on earth. Although not actually zodiacal factors, the declinations of certain planets and changes in the elements of planetary orbits are found to be strong components in the astrological theory of world cycles.

Above and beyond true physical phenomena is the strange tendency of world affairs toward cycles which reflect the general connotations of successive zodiacal signs. This is apparent if one reconsiders the famous historical analyses of Oswald Spengler in the light of astrology. Spengler’s anthropomorphic outlines of spiritual, cultural and political “contemporary epochs” seem to follow a fascinating zodiac of characteristics, commencing each broad swing in mankind’s affairs with typical Aries qualities, and culminating it, after ten more eras, with Piscean attributes. The reason for this inclination is inexplicable, at the present, as no astronomical connection has been discovered.

Mention of such interesting matters lays the groundwork for our immediate subject — that of applying astrology as a calculable gauge of contemporary economic conditions.

The Gann 707 Fractal | Allen Reminick

W.D. Gann understood the nature of how markets expand, how they contract, the differences between time frames and the similarities between them. Nowadays we call this fractal geometry. Fractal geometry is extremely important to understand how markets develop and has been used by various market technicians. 
 
How do we use the 707 fractal to forecast the next few months in the S&P 500? In our most recent forecasts we've talked about a continued rally into the 20th or 25th of September 2023, and probably another high around October 3rd. After that we're looking for a decline that may be somewhat severe:


The number 707 shows up here on several different time frames. In the chart below the blue line is the 240 minute bar chart of the S&P 500 Futures shifted forwards by 707 units, and the red bars above are the actual current market: 
 

What is really interesting is that 707 weeks (707 weeks ≈ 12.9 years) and 707 months (≈ 58.916 years) are also repeating. This is where the concept of fractals comes in. Different time frames are having the same form or pattern. Look at this chart of the weekly S&P 500:
 
The major low of 2009 and the major low of October 2022 are 707 weeks apart.
 
The low in 2009 lines up to the week with the low in October 2022 - the major low that kicked off the whole bull market since 2009. This is lining up exactly with the low in October 2022, and the pattern in the decline between 2008 matches the decline in 2022. Even though the price action was much more severe back then, the form was the same. And we are talking about the form and now the rally that was taking place since October is also repeating very nicely 2009 into 2010 and 2011. 
 
 
So we saw two examples of 707, the first on the 240 minute bar chart and the second on the weekly chart. From this we take it one step further and look at 707 months (58.916 years). 707 months turns out to be two times the exact length of the cycle of Saturn. 25.457 years is the exact number of years of Saturn's revolution times two which equals 707 months to the day = 10,759 days.

 
See also: