 |
| The above chart shows the Average Annual Cycle based on S&P 500 Index close values from 1950 to 2018. Upcoming important turning points in this cycle during 2019 are: Jan 07 (Mon) High Jan 14 (Mon) Low Jan 25 (Fri) High Feb 09 (Sat) Low Mar 12 (Tue) High Mar 29 (Thu) Low Jun 08 (Sat) High Jul 01 (Mon) Low Aug 29 (Thu) High Oct 28 (Mon) Low Nov 08 (Fri) High Dec 23 (Mon) Low |
Sunday, December 30, 2018
S&P 500 Index vs Average Annual Cycle | Turning Points 2019


Saturday, December 29, 2018
S&P 500 Index vs Equity Put / Call Ratio | Overbought
 |
| Up-Turn on Dec 26 (Wed) on decreasing volume + (P/C Ratio + RSI2 @ Extremes + NR4/NR7 + Negative Close above 3DMA) = High + Sideways to Down on Dec 31 (Mon) into Jan 03 (Thu) = Perihelion | Jan 5 (Sat) = New Moon + Solar Eclipse |
S&P 500 vs 18.61 Year Cycle | Sideways to Down into Jan 03 - 09 (Thu-Wed)
 |
| The more precise 18.6 year projection HERE is suggesting a Dec 28 (Fri) High and a Jan 05 (Sat) Low. |
Saturday, December 22, 2018
S&P 500 vs Planets under Fire | The Concept of Combustion
 |
| Indian astrology cultivates the idea that a planet in geocentric conjunction with the Sun is burned by the massive heat and fire, hence it combusts, is losing its luster and shine, and becomes powerless. The event is called combustion, and the affected planet becomes a combust planet. The Sanskrit word for combustion is kopa, meaning angry. However, the chart above extends this concept of combustion by the parallel of declination of planets and the Sun. A parallel aspect is formed between two planets with the same declination or distance north or south of the ecliptic. If the planets are both North or both South of the ecliptic, the parallel aspect is read as a conjunction. If they are the same declination but one is North and one is South, then the contra-parallel is read as a 180 degree opposition. These aspects are strongest when the orb is kept to 1 degree. They can also magnify the intensity of any other aspect between the two planets or points. Planets in geocentric conjunctions of longitude [000] and declination [#] with the Sun are: 2018 Oct 26 (Fri) 10:16 = SUN # VEN + SUN 000 VEN 2018 Nov 03 (Sat) 10:49 = SUN # VEN 2018 Nov 05 (Mon) 00:05 = SUN # MAR 2018 Nov 21 (Wed) 23:55 = SUN # JUP 2018 Nov 25 (Sun) 23:42 = SUN # MER 2018 Nov 26 (Mon) 01:33 = SUN # JUP + SUN 000 JUP 2018 Nov 27 (Tue) 04:14 = SUN # MER + SUN 000 MER 2018 Dec 02 (Sun) 18:33 = SUN # PLU 2018 Dec 07 (Fri) 11:00 = SUN # SAT 2018 Dec 31 (Mon) 07:37 = SUN # MER 2019 Jan 02 (Wed) 00:49 = SUN # SAT + SUN 000 SAT 2019 Jan 06 (Sun) 22:58 = SUN # SAT 2019 Jan 10 (Thu) 11:35 = SUN # PLU 2019 Jan 11 (Fri) 00:37 = SUN # JUP 2019 Jan 11 (Fri) 06:38 = SUN # PLU + SUN 000 PLU 2019 Jan 22 (Tue) 06:04 = SUN # VEN 2019 Jan 29 (Tue) 21:49 = SUN # MER + SUN 000 MER 2019 Feb 06 (Wed) 10:59 = SUN # MER 2019 Mar 04 (Mon) 10:51 = SUN # NEP 2019 Mar 06 (Wed) 20:00 = SUN # NEP + SUN 000 NEP 2019 Mar 14 (Thu) 21:46 = SUN # MER + SUN 000 MER 2019 Mar 18 (Mon) 11:24 = SUN # MER 2019 Mar 22 (Fri) 14:47 = SUN # CHI + SUN 000 CHI 2019 Mar 30 (Sat) 05:53 = SUN # CHI 2019 Apr 21 (Sun) 08:28 = SUN # URA 2019 Apr 22 (Mon) 19:07 = SUN # URA + SUN 000 URA 2019 May 21 (Tue) 09:06 = SUN 000 MER Previous correlations between the stock market and combustion events HERE |
Thursday, December 13, 2018
Contraction > Breakout > Expansion | Toby Crabel's Price Patterns
 |
| Larry Williams described all of market's action in 8 patterns characterized by direction, contraction and expansion (e.g. HERE) |
In 1990 Toby Crabel published Day Trading With Short Term Price Patterns and Opening Range Breakout. The book is about the fundamental nature of price action, about contraction and expansion, the ebb and flow of price in all markets. Looking at daily bar charts, expect breakouts and / or changes in trend after the following price bar patterns:
Narrow Range (NR): A price bar's range less than the previous bar's range. The opposite of NR is Wide Spread (see below). NR is technically NR2 when
compared to NR4, NR5, and NR7 (see below; more e.g. HERE).
Narrow Range 4 (NR4): A price bar's range less than the previous 3 bars' ranges is the narrowest range in 4 days or NR4.
The opposite is WS4 (see below; more e.g. HERE).
 |
| On Dec 13 (Thu) the E-mini Nasdaq 100 Futures and other US stock indices performed a IDnr4 down day. |
Narrow Range 5 (NR5): A price
bar's range less than the previous 4 bars' ranges is the narrowest range in 5 days or NR5.
The opposite is WS5.
Narrow Range 7 (NR7): A price bar's range less than the previous 6 bars' ranges is the narrowest range in 7 days or NR7. The opposite is WS7 (more e.g. HERE).
Wide Spread (WS): A price bar's range wider than the previous bar's range is a WS. The opposite is NR. WS is technically WS2 when compared to WS4, WS5, and WS7 (more e.g. HERE).
Wide Spread 4 (WS4): A price bar's range wider than the previous 3 bars' ranges is the widest range in 4 days or WS4. The opposite is NR4.
Wide Spread 5 (WS5): A price bar's range wider than the previous 4 bars' ranges is the widest range in 5 days or WS5. The opposite is NR5.
Wide Spread 7 (WS7): A price bar's range wider than the previous 6 bars' ranges is the widest range in 7 days or WS7. The opposite is NR7.
Inside Day (ID): If the high of the current day is lower than the high of the previous day AND the low of the current day is higher than the low of the previous day we have an ID or Inside Day. The opposite is an OD (more e.g. HERE).
Outside Day (OD): If the high of the current day is higher than the high of the previous day AND the low of the current day is lower than the low of the previous day then we have an OD or Outside Day. The opposite is an ID (more e.g. HERE).
Inside Day (ID) and NR4 (IDnr4): An IDnr4 is a combination of an ID and a NR4. This happens when the current day's high is lower than the previous day's high AND the current day's low is higher than the previous day's low AND the range is the narrowest when compared to the previous 3 trading days (more e.g. HERE).
2 Bar Narrow Range (2BNR): The 2-day-range (the higher of the 2 highs less the lower of the 2 lows) is the narrowest 2-day-range in the last 20 trading sessions.
3 Bar Narrow Range (3BNR): The 3-day-range (the higher of the 3 highs less the lower of the 3 lows) is the narrowest 3-day-range in the last 20 trading sessions.
4 Bar Narrow Range (4BNR): The 4-day-range (the higher of the 4 highs less the lower of the 4 lows) is the narrowest 4-day-range in the last 30 trading sessions.
8 Bar Narrow Range (8BNR): The 8-day-range (the higher of the 8 highs less the lower of the 8 lows) is the narrowest 8-day-range in the last 40 trading sessions.
BearHook: A NR with the Open less than the previous bar's Low AND the Close greater than the previous bar's Close (more e.g. HERE).
BullHook: A NR with the Open greater than the previous bar's High AND the Close less than the previous bar's Close (more e.g. HERE).
Stretch: The Stretch is calculated by taking the 10 period SMA of the absolute difference between the Open and either the High or Low, whichever difference is smaller. For example: if Open = 1,250, High = 1,258, Low = 1,240, then take the value of 8 for that day because 1,258 - 1,250 = 8 which is smaller than 1,250 - 1,240 = 10. Then add together all of these values for the last 10 trading days and divide this by 10 to get the 10 day SMA. This value will then become the Stretch. The Stretch is used in calculating where to enter the trade and where to place a stop using the ORB and ORBP trading strategies (see below).
Simple Moving Average (SMA): An SMA is calculated over a number of candles/bars in a chart as the simple average value of that number of bars, e.g. the SMA for the last 10 days closing prices of the DJIA: add together the closing prices for the last 10 days of the DJIA and then divide that by 10 = 10 day SMA. You do not need to use just the closing price to calculate this. You can also use the Open, High, Low, and Close or a combination of any of those, e.g. HLC/3.
Opening Range Breakout (ORB): Using this strategy, a buy stop is placed just above the Open price plus the Stretch and a sell stop just below the Open price minus the Stretch. The first stop triggered enters the trader into the trade and the other stop becomes the protective stop. The earlier in the trading session the entry stop is hit the more likely the trade will be profitable at the close. A market movement that kicks off a trend quickly in the current trading session could add significant profit to a trader's position by the close and should be considered for a multi-day trade. As time passes and we are not filled early on then the risk increases and it becomes prudent to reduce the size of the position during the day. Trades filled towards the end of the day carry the most risk and the later in the day the trade is filled the less likely the trader will want to carry that trade overnight (more e.g. HERE).
Variations of this strategy include the Opening Range Breakout Preference (ORBP): An ORBP trade is a one sided ORB trade. If other technical indicators show a strong trend in one direction then the trader will exercise a "Preference" for the direction in which to trade the ORB trade. A stop to open a position would be placed on the side of the trend only and if filled a protective stop would then be placed. The calculation of where to place the "stop to open" would be the same as that for the ORB trade: For longs, the Open price plus the Stretch and for shorts the Open price minus the Stretch. The ORBP trade is a specialized form of the ORB trade (more e.g. HERE).


Saturday, December 8, 2018
S&P 500 Index vs AstroMetric Indicator | December 2018
 |
| This indicator points to more volatility in US equity markets next week. Dec 12 (Wed) or Dec 14 (Fri) will likely print an intermediate low, followed by a rally into year's end. Previous performance of the indicator HERE |
Saturday, December 1, 2018
S&P 500 Index vs Lunar Declination + Latitude | December 2018
 |
| Recent and upcoming events: Nov 29 (Thu) 19:09 = MOO Lat @ 0 = SUN 270° MOO = 3rd Quarter Nov 30 (Fri) = SoLunar Turn-Day Dec 02 (Sun) 05:59 = MOOn Declination @ 0 Dec 03 (Mon) 11:05 = Moon Latitude @ Max Dec 04 (Tue) = SoLunar Turn-Day Dec 07 (Fri) 00:49 = SoLunar Turn-Day = New Moon = SUN 000 MOO Dec 09 (Sun) 06:14 = Moon Declination @ Min Dec 10 (Mon) 12:58 = MOOn Latitude @ 0 Dec 11 (Tue) = SoLunar Turn-Day Dec 12 (Wed) 06:57 = Moon @ Apogee Dec 15 (Sat) 07:06 = SUN 090 MOO = 1st Quarter Dec 16 (Sun) 18:23 = MOOn Declination @ 0 Dec 17 (Mon) 23:04 = Moon Latitude @ Min Dec 18 (Tue) = SoLunar Turn-Day Dec 22 (Sat) 14:05 = SoLunar Turn-Day = Full Moon = SUN 180 MOO Dec 23 (Sun) 06:40 = Moon Declination @ Max Dec 24 (Mon) 06:53 = Moon Latitude @ 0 + Moon @ Perigee Dec 29 (Sat) 04:18 = SUN 270° MOO = 3rd Quarter + Moon Declination @ 0 Dec 30 (Sun) 14:54 = Moon Latitude @ Max [calculated for New York City = EST] |
Declinations of Sun, Moon and Planets 2019 | Parallels and Extremes
 |
| The Parallel Aspect is formed between two planets with the same declination or distance north or south of the ecliptic. If the planets are both North or both South of the ecliptic, the parallel aspect is read as a conjunction. If they are the same declination but one is North and one is South, then the contra-parallel is read as a 180 degree opposition. These aspects are strongest when the orb is kept to 1 degree. They can also magnify the intensity of any other aspect between the two planets or points. Declination exceeding the extremes of the Sun's declination (= out of bounds = ± 23.27⁰ geocentric or ±7.15⁰ heliocentric) oftentimes correlates with (mostly minor) changes in trend in financial markets (HERE). Daily Declination Ephemerides can be found e.g. HERE Declinations and Latitudes can be calculated online e.g. HERE |
Geocentric and Heliocentric Bradley Indices │ Turning Points 2019


2018 Dec 03 (Mon) = Low (helio)
2018 Dec 18 (Tue) = High (geo+helio)
2019 Jan 17 (Thu) = Low (geo)
2019 Jan 21 (Mon) = Low (helio)
2019 Feb 07 (Thu) = High (geo)
2019 Feb 10 (Sun) = Low (geo)
2019 Feb 19 (Tue) = High (geo+helio)
2019 Feb 27 (Wed) = Low (geo)
2019 Feb 28 (Thu) = Low (helio)
2019 Mar 17 (Sun) = High (helio)
2019 Mar 18 (Mon) = High (geo)
2019 Mar 31 (Sun) = Low (geo+helio)
2019 Apr 11 (Thu) = High (geo+helio)
2019 Apr 19 (Fri) = Low (geo+helio)
2019 Apr 22 (Mon) = High (geo+helio)
2019 Apr 28 (Sun) = Low (geo+helio)
2019 May 16 (Thu) = High (geo+helio)
2019 May 30 (Thu) = Low (geo+helio)
2019 Jun 02 (Sun) = High (geo)
2019 Jun 03 (Mon) = High (helio)
2019 Jun 16 (Sun) = Low (geo)
2019 Jun 16 (Sun) = Low (helio)
2019 Jul 04 (Thu) = High (geo+helio)
2019 Jul 11 (Thu) = Low (geo)
2019 Jul 15 (Mon) = Low (helio)
2019 Jul 23 (Tue) = High (geo+helio)
2019 Jul 29 (Mon) = Low (geo+helio)
2019 Aug 07 (Wed) = High (geo)
2019 Aug 09 (Fri) = High (helio)
2019 Aug 15 (Thu) = Low (helio)
2019 Aug 16 (Fri) = Low (geo)
2019 Aug 22 (Thu) = High (geo)
2019 Aug 29 (Thu) = High (helio)
2019 Oct 07 (Mon) = Low (geo+helio)
2019 Oct 18 (Fri) = High (geo+helio)
2019 Oct 29 (Tue) = Low (helio)
2019 Oct 30 (Wed) = Low (geo)
2019 Nov 10 (Sun) = High (geo+helio)
2019 Nov 17 (Sun) = Low (helio)
2019 Nov 18 (Mon) = Low (geo)
2019 Nov 29 (Fri) = High (geo)
2019 Nov 30 (Sat) = High (helio)
2019 Dec 19 (Thu) = Low (geo)
2019 Dec 21 (Sat) = Low (helio)
2019 Dec 29 (Sun) = High (geo)
2020 Jan 08 (Wed) = High (helio)
2020 Jan 15 (Wed) = Low (geo)
2020 Jan 20 (Mon) = Low (helio)
2020 Feb 01 (Sat) = High (geo)
[calculated for
New York City]
Some background on the Bradley Indices
and previous turning points HERE
Some background on the Bradley Indices
and previous turning points HERE
 |
| Donald A. Bradley (1950) - Stock Market Prediction (HERE) |


S&P 500 Index vs Jupiter – Saturn Cycle | December 2018
 |
| Recent and upcoming turn-days: Nov 29 (Thu), Dec 04 (Tue), Dec 08 (Sat), Dec 12 (Wed), Dec 18 (Tue), Dec 25 (Tue), Dec 27 (Thu), Dec 29 (Sat), Jan 03 (Thu), Jan 08 (Tue). Previous turn-days HERE |
Cosmic Cluster Days | December 2018 - January 2019
 |
| Upcoming Cosmic Cluster Days in December and January are: Nov 28 (Wed), Dec 12 (Wed), Dec 14 (Fri), Dec 24 (Mon), Jan 10 (Thu), Jan 20 (Sun), Jan 23 (Wed), Jan 24 (Thu), Feb 02 (Sat). Previous CCDs are HERE |
 |
| Review of S&P 500 Index vs Cosmic Cluster Days in November 2018 | Preview for December 2018. |
SoLunar Map | December 2018 - January 2019
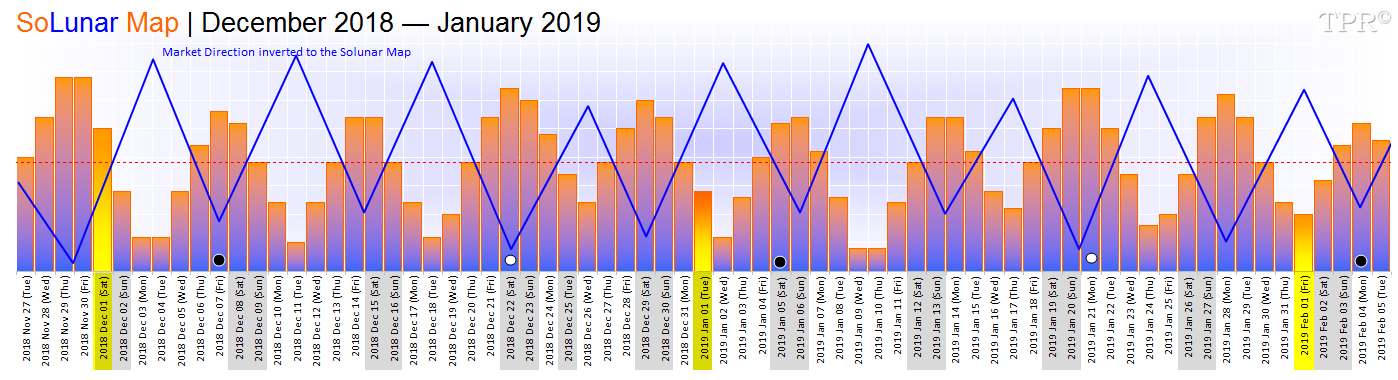 |
| Upcoming SoLunar Turn-Days are: Dec 04 (Tue), Dec 07 (Fri), Dec 11 (Tue), Dec 15 (Sat), Dec 18 (Tue), Dec 22 (Sat), Dec 26 (Wed), Dec 29 (Sat), Jan 02 (Wed), Jan 06 (Sun), Jan 09-10 (Wed-Thu), Jan 13-14 (Sun-Mon), Jan 17 (Thu), Jan 20-21 (Sun-Mon), Jan 24 (Thu), Jan 28 (Mon), Feb 01 (Fri). Previous SoLunar Maps HERE |

 |
| Review of S&P500 vs SoLunar Map during November 2018 | Preview for December 2018. |
Thursday, November 22, 2018
S&P 500 Index vs Sunspots | Transition from Solar Cycle #24 to #25


Last weekend, a small ephemeral sunspot appeared in the Sun's northern hemisphere, only to vanish a few hours later. The magnetic field of the spot was reversed, marking it as a member of the upcoming solar cycle (see data, e.g., HERE). Sunspot AR2727 appeared just north of the Sun’s equator. This sunspot still belongs to the decaying Solar Cycle #24, which peaked between 2012 and 2014. However, its magnetic polarity is already aligned with that of the other, yet unnumbered sunspot located at a higher latitude. These two sunspots have opposite magnetic polarities.
According to Hale's Law, this indicates that the two sunspots belong to different solar cycles. The high-latitude sunspot appears to be a harbinger of Solar Cycle #25. Solar cycles often blend at their boundaries. Indeed, ephemeral sunspots possibly linked to Solar Cycle #25 were reported on December 20, 2016, and April 8, 2018. Now, November 17, 2018, can be added to this list. The slow transition between Solar Cycle #24 and Solar Cycle #25 seems to be underway.
S&P 500 Index vs 18.61 Year Lunar Node Cycle | Nov 27 (Tue) Low
 |
| This 2000-2018 Analog projects some sort of a low on Nov 27 (Tue), some sort of a rally into Dec 09 (Sun), another decline into Dec 22 (Sat), a high on Dec 28 (Fri), and a low on Jan 05 (Sat). |
Tuesday, November 6, 2018
S&P 500 Index vs Lunar Node Speed | The Moon's Rhythm in November 2018
 |
| S&P 500 Index vs True Lunar Node Speed @ 0 and Extremes | 30 Day CIT Forecast. On Nov 07 (Wed) the lunar node's speed will reach a short term minimum. Stock indices are likely to move sideways-to-down from Nov 08 (Thu) into Nov 12 (Mon). |
Saturday, October 27, 2018
S&P 500 Index vs Jupiter – Saturn Cycle | November 2018
 |
| Recent and upcoming turn-days: Oct 22 (Mon), Oct 26 (Fri), Oct 30 (Tue), Nov 03 (Sat), Nov 08 (Thu), Nov 12 (Mon), Nov 16 (Fri), Nov 21 (Wed), Nov 25 (Sun), Nov 29 (Thu), Dec 04 (Tue), Dec 08 (Sat). Previous turn-days HERE |
Saturday, September 29, 2018
S&P 500 Index vs Jupiter – Saturn Cycle | October 2018
 |
| Recent and upcoming turn-days: Sep 25 (Tue), Sep 30 (Sun), Oct 05 (Fri), Oct 06 (Sat), Oct 07 (Sun), Oct 11 (Thu), Oct 16 (Tue), Oct 22 (Mon), Oct 26 (Fri), Oct 30 (Tue), Nov 03 (Sat), Nov 08 (Thu). Previous turn-days HERE |
Cosmic Cluster Days | October - November 2018
 |
| Upcoming Cosmic Cluster Days in October and November are: [Sep 23 (Sun)] Oct 04 (Thu), Oct 15 (Mon), Oct 23 (Tue), Oct 24 (Wed), Oct 26 (Fri), Oct 27 (Sat), Nov 11 (Sun), Nov 18 (Sun), Nov 28 (Wed), Dec 12 (Wed). Previous CCDs are HERE |
 |
| Review of S&P 500 Index vs Cosmic Cluster Days in September 2018 | Preview for October 2018. |
SoLunar Map | October - November 2018

 |
| Upcoming SoLunar Turn-Days are: Sep 28 (Fri), Oct 02 (Tue), Oct 06 (Sat), [Oct 08 (Mon) 22:08 = New Moon] Oct 09 (Tue), Oct 13 (Sat), Oct 17 (Wed), Oct 20 (Sat), Oct 24 (Wed) 14:26 = Full Moon, Oct 27 (Sat), Oct 31 (Wed), Nov 04 (Sun), Nov 07 (Wed) 09:23 = New Moon, Nov 08 (Thu), Nov 11 (Sun), Nov 15 (Thu), Nov 19 (Mon), Nov 23 (Fri) 02:10 = Full Moon, Nov 26 (Mon), Nov 30 (Fri), Dec 04 (Tue). Previous SoLunar Maps HERE |
 |
| Review of S&P500 vs SoLunar Map during September 2018 | Preview for October 2018. |
Monday, August 27, 2018
S&P 500 Index vs 18.61 Year Nodal Cycle | Aug 27, 2018 = Jan 14, 2000
 |
| Jan 14, 2000 (Fri = Major High in DJIA) + 6,800 CD = Aug 27, 2018 (Mon) A high should print around Aug 30 (Thu) ± 1 CD. Aug 30 will be also 195 Solar Degrees of geocentric longitude from the Major Low on Feb 09 (Fri) and 1,440 Lunar Degrees from the Low on May 03 (Thu). |
Saturday, August 18, 2018
S&P 500 Index vs W.D. Gann's Mass Pressure Chart | Update August 2018

 |
| Since early February the S&P 500 Index has closely been following the Gann Mass Pressure Chart, and suggests that August 7 (Tue) marked a major high and Aug 15 (Wed) an intermediate low. The rally should now pause for about two days into August 21 (Tue) before continuing into August 25 (Sat). Next would be a swing down into the last trading day of August. From there the Mass Pressure Chart moves sideways-to-down to another major low end of October. From there the Mass Pressure Chart rises into the last trading day of 2018. More on the concept of Gann's Mass Pressure Chart HERE |
Sunday, August 5, 2018
S&P 500 Index vs Natural Trading Days | Cluster ± August 8-9 (Wed-Thu)
 |
| Aug 08 (Wed) = 90 TD from Apr 02 (Mon) Low + 180 CD from Feb 09 (Fri) Low + True Lunar Node Speed @ Max + MOO @ Max N-Declination Aug 09 (Thu) = 135 TD from Jan 26 (Fri) Major High + SUN 000 MER + VEN contra parallel SAT (heliocentric) + VEN 120 URA (h) + VEN 090 SAT (h). |
 |
| S&P 500 Index vs True Lunar Node Speed @ 0 and Extremes | 30 Day CIT Forecast |
Saturday, August 4, 2018
S&P 500 Index vs Delta Cycle | August 2018 - Update
 |
| | Aug 06 (Mon) Low | Aug 7 (Tue) up + High | Aug 08 (Wed) Sideways-to-Low | Aug 09 (Thu) Sideways-to-High | Aug 10 (Fri) Sideways-to-Low | Aug 13-15 (Mon-Wed) High. There will be a Partial Solar Eclipse (Super New Moon) on Aug 11 (Sat) 09:46 (EDT). |
Russell 2000 Index vs Delta Cycle | August 2018 - Update
 |
| | Aug 06 (Mon) Low | Aug 7 (Tue) up + High | Aug 08 (Wed) Sideways-to-Low | Aug 09 (Thu) Sideways-to-High | Aug 10 (Fri) Sideways-to-Low | Aug 13-15 (Mon-Wed) High | |
Sunday, July 29, 2018
S&P 500 Index vs Delta Cycle | August 2018
 |
| Jul 30 (Mon) Low | Aug 2 (Thu) High | Aug 06 (Mon) Low | Aug 15 (Wed) High | Aug 30 (Thu) Low | Sep 10 (Mon) High |
S&P 500 Index vs Delta of Inverted VIX | August 2018
 |
| Jul 30 (Mon) Low | Aug 2 (Thu) High | Aug 06 (Mon) Low | Aug 14 (Tue) High |
Russell 2000 Index vs Delta Cycle | August 2018
 |
| Jul 30 (Mon) Low | Aug 2 (Thu) High | Aug 06 (Mon) Low | Aug 15 (Wed) High |
S&P 500 Index vs Lunar Declination + Latitude | August 2018
 |
| Recent and upcoming events: Jul 27 (Fri) 16:20 + 18:38 = Full Moon + MOO Lat @ 0 = Total Lunar Eclipse = SoLunar Turn-Day Jul 31 (Tue) 22:27 = SoLunar Turn-Day Aug 02 (Thu) 04:29 = MOO Dec @ 0 Aug 04 (Sat) 02:16 = MOO Lat @ Min + SUN 270° MOO = SoLunar Turn-Day Aug 07 (Tue) 01:49 = SoLunar Turn-Day Aug 08 (Wed) 18:22 = Moon Declination @ Max Aug 10 (Fri) 14:01 = Moon @ Perigee Aug 11 (Sat) 04:23 = SoLunar Turn-Day = Partial Solar Eclipse (Super New Moon) Aug 15 (Wed) 10:52 = SoLunar Turn-Day Aug 16 (Thu) 15:31 = Moon Latitude @ Max Aug 18 (Sat) 03:32 = SUN 090 MOO = 1st Q Aug 19 (Sun) 00:25 = SoLunar Turn-Day Aug 21 (Tue) 22:57 = Moon Declination @ Min Aug 22 (Wed) 02:33 = SoLunar Turn-Day Aug 23 (Thu) 07:55 = Moon @ Apogee Aug 26 (Sun) 09:46 = SoLunar Turn-Day = Full Moon = SUN 180 MOO Aug 29 (Wed) 09:11 = SoLunar Turn-Day Aug 31 (Fri) 07:20 = Moon Latitude @ Min Sep 02 (Sun) 22:48 = SUN 270° MOO = 3rd Q Sep 03 (Mon) 13:24 = SoLunar Turn-Day [all times calculated for New York City = EST/EDT] |
Saturday, July 28, 2018
S&P 500 Index vs Jupiter – Saturn Cycle | August 2018
 |
| Recent and upcoming turn-days: Jul 29 (Sun), Aug 02 (Thu), Aug 07 (Tue), Aug 11 (Sat), Aug 15 (Wed), Aug 21 (Tue), Aug 29 (Wed), Aug 31 (Fri), Sep 01 (Sat), Sep 06 (Thu), Sep 11 (Tue). Previous turn-days HERE |
S&P 500 Index vs Cosmic Cluster Days | August 2018
 |
| Upcoming Cosmic Cluster Days are: Jul 28 (Sat), Jul 31 (Tue), Aug 13 (Mon), Aug 14 (Tue), Aug 19 (Sun), Aug 22 (Wed), Aug 24 (Fri), Sep 06 (Thu). Previous CCDs are HERE |
Subscribe to:
Posts (Atom)