Showing posts sorted by date for query toby crabel. Sort by relevance Show all posts

Saturday, July 19, 2025

"Bull Hook" Toby Crabel Price Pattern in the S&P 500

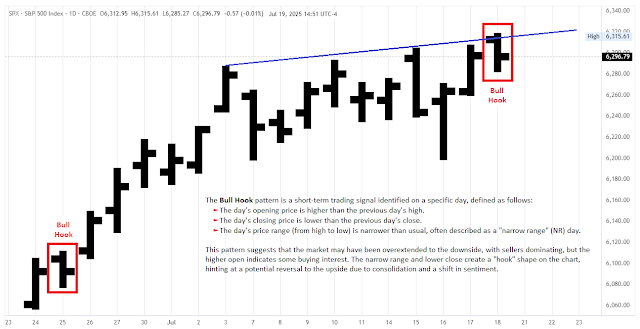
The Toby Crabel Bull Hook pattern, present on July 18 (Fri), in the S&P 500 Cash Index, implies a potential short-term upward move for trading starting July 21, 2025. 
 
A Bull Hook happens when a bar has a lower range than the previous one, with its opening price
higher than the previous bar’s high and its closing price lower than the previous bar’s close.
 
Price action created the narrowest range of the last 8 days with a lower daily close. The daily bar has a "hook" shape (a bull flag on lower timeframes), hinting at a potential reversal to the upside due to consolidation and a shift in sentiment. The Bull Hook pattern is generally bullish, opening above the previous day's high and closing lower with a narrowing range. It's often followed by upward price moves in the days after. 
 
A recent analysis by Ali Casey provides additional insights. The Bull Hook pattern has limitations, including its better performance in trending or volatile markets, the potential for false signals and losses in some cases, and its reliance on precise execution, which can be influenced by news or macroeconomic events.
 

Sunday, July 13, 2025

"8 Bar Narrow Range" (8BNR) Toby Crabel Price Pattern in the NASDAQ

The 8 Bar Narrow Range (8BNR) is a technical trading pattern developed by Toby Crabel, introduced in his book "Day Trading with Short Term Price Patterns and Opening Range Breakout". 
 
 
It is part of his framework of price action patterns that focus on periods of volatility contraction (narrow price ranges) as precursors to potential volatility expansion (significant price movements). Here's an explanation of what the 8BNR pattern suggests and its implications for traders:

The 8BNR pattern occurs when the 8-day range (the difference between the highest high and the lowest low over an 8-day period) is the narrowest range compared to any other 8-day period within the last 40 trading sessionsThis indicates a period of low volatility or price consolidation, where the market has been trading in a relatively tight range over the past eight days compared to recent history.

The 8BNR signals a potential breakout, but it does not specify the direction. Traders often use the pattern in conjunction with Crabel’s ORB strategy:
 
Long Trade: Place a buy stop order at the open price plus the "stretch" (a calculated value based on the 10-day simple moving average of the smaller difference between the open and high/low).
Short Trade: Place a sell stop order at the open price minus the stretch.
 
Crabel’s research suggests that breakouts are more likely to be profitable if they occur early in the trading session. Trades triggered later in the day carry higher risk and may warrant smaller position sizes or avoidance of overnight holds. The 8BNR is more reliable when it occurs after a clear trend or during a pullback in a trending market. Multiple narrow range patterns in close proximity (e.g., consecutive NR7 or 3BNR, 4BNR, 8BNR days) may indicate congestion, reducing the reliability of the breakout.


Like all technical patterns, the 8BNR is not foolproof. False breakouts, market noise, or unexpected events can lead to losses. Traders should avoid mechanical application and incorporate additional technical or fundamental analysis to confirm signals. Always combine the pattern with other market analysis for best results.
  

Sunday, February 16, 2025

Six Million Pageviews

Thank you for your interest in my 'Snippets from the Diary of a Trader'. Six million pageviews. Amazing. Who would have thought. I created this blog in 2012, initially as a personal online backup for notes on what I picked up and developed from posts in Yahoo! Groups. 


I first became aware of the stock markets' potentials in the 1990s, when I made some considerable gains, driven by a combination of hearsay and pure luck. It was nice, but I had better things in mind. I was eager to start working as a young geologist across all continents. Being on missions, often facing poor or no internet and working in time zones far from London and New York, I didn’t seriously start trading until 2018.

I quickly realized that most of my earlier musings and ventures into Gann, Bayer, and various financial astrology concepts weren’t particularly helpful for my practical goal of making real money in the markets. I started with automated trading systems; the drawdowns and returns made me sick. This came to an end the moment I lost all of my hardware, software, files, and backups. During COVID-19 I shifted my focus back to patterns, market structure, price action, timing, and short-term trading setups and techniques.   

 
» The three traits that speculators must learn to manage within
themselves are confidence, fear, and aggressiveness.
«
GOAT trading teacher.
Studying the works of Toby Crabel, Larry Williams, Richie Naso, Steve Mauro, ICT, Stacey Burke, Jevaunie Daye, D'onte Goodridge, Frank Ochoa, and Jeff Hirsch has been most helpful to my progress. They blew away all the retail-trader instruction crap I had previously gathered. Forever grateful. Snippets of some of their teachings are featured on this page: no indicators; reading naked bar-charts; knowing average, small, and large ranges; understanding logic and precision in patterns; accumulation, manipulation and distribution phases; ICT-lingo, concepts, setups, etc.. 
 
Short-term patterns in financial markets are governed by timed market maker algorithms. They repeat over and over again. Price always moves from liquidity to inefficiency and vice versa, or from internal liquidity to external liquidity and vice versa, and there are only three things price action can do: break out from a range and trend, break out from a range and reverse, or range between previous highs and lows. Hence there are three main patterns: range, breakout-and-trend, and reversal patterns. Pump and Dump. At first I didn't really notice nor understand these patterns, order blocks, imbalances and liquidity levels, until it became impossible not to see them. They are everywhere, and precise to the pips. 
 

»
Think like a criminal. «
Veteran Wall Street Trader Richie Naso

It’s been quite a journey; one never stops learning. While I'm aware that there are myriad other, maybe smarter, and more efficient ways to make more money more quickly in the markets; my approach works just fine for me. I primarily trade the S&P 500, the NASDAQ, Gold, and Crude Oil. Peace of mind, health, endurance, discipline, patience, and risk management are most important. Never bet the farm. Greed is not good. Have a coat for rainy weather. I hope you find value, inspiration, shortcuts, and benefits in my snippets. Spread the love, and may peace and God's blessings be upon you.
Monday, January 20, 2025

How Markets Move: The Natural Cycle of Range Change │ Larry Williams

Markets typically shift from small ranges to larger trend moves. When the market is in a large trend move, wait for it to settle into smaller ranges before getting involved. This gives more reliable setups when the market trends again. Market tops generally occur when the price closes well off its low, while market bottoms happen when the price closes near its low. Most traders get emotional during these times, buying at tops and selling at bottoms. Once you understand this, it becomes easier to make smarter trades.

Small Ranges Beget Large Ranges. Large Ranges Beget Small Ranges.


Markets move from congestion to creation (expansion), transitioning from small ranges to larger, more defined trend moves. A small range signals buildup, and a large range signals an impending trend. If I see a small net change from open to close, I know a large trend move is likely coming and am prepared to act on it. Here’s an example using the NASDAQ: Notice how volume fluctuates throughout the day: heavy volume in the morning, a dip in the middle, and a surge towards the end. 

"U" shaped intraday: Heavy volume in the morning, a dip in the middle, a surge at the end.

This pattern is consistent across markets. It’s like a freeway: traffic is heavy in the morning, dies down in the middle of the day, and picks up in the afternoon. Understanding this helps day traders identify opportunities in the morning and towards the end of the day, while avoiding the midday lull. Volume drives range, and large ranges happen at the start and end of the day. This is when short-term traders make money. We need volatility and large ranges to profit.

 There are three key cycles in market behavior: 
(1) small range/large range, (2) moving closes within ranges, and (3) closes opposite openings. 
All three cycles work equally well in any timeframe and market.
"Do yourself a big favor: Mark off all the large-range days [in the chart above], and then study the size of the ranges just
prior to explosive up-and-down days. See what I see? We are given ample warning of virtually every large-range day 
by the shrinkage of ranges a few days earlier."

The key takeaway for short-term traders is that not every day offers a high-probability trade. You need to identify days with potential for explosive moves and not expect large profits daily. It’s about finding that opportunity.

As for market tops, they usually occur when prices close near their highs, and bottoms happen when prices close near their lows. Focus on these closing patterns to determine when to buy and sell.

Trend is a function of time. The more time in a trade, the more opportunity for trend.

The most important insight in trading is that trends are the basis of all profits. Without a trend, there are no profits. But what causes trends? Trends are fundamentally a function of time—the more time you hold a trade, the more opportunity for a trend to develop. The challenge with day trading is that trends occur only about 15% of the time. Most of the time, prices are consolidating, making it difficult to catch a big trend move. Limiting yourself to a few hours of trading only targets that small window when trends are likely to occur.

 My Day Trade Secret: HTTC - Hold To The Close.

The day trader dilemma is that they have limited time to catch trends. Holding positions overnight allows you to capture longer trends and larger profits. A small bet with the potential for a big move is the key advantage of holding positions over time. 
 
 » How you know a large trend move is coming. «
 
Many day traders are afraid to hold positions overnight. However, if you do the math, you'll see that most market moves happen between the close of one day and the open of the next. Moves within the day are often smaller and less reliable. For short-term traders, the key to success is recognizing large range days and holding positions to the close. This is how you catch a big move during the day.
 
 
 » Hold To The Close. « 
S&P 500 E-mini Futures (daily bars).
 Narrow Range 4 & 7 Days and Inside Bar Narrow Range 4 & 7 Days.

 Narrow Range 4 & 7 Days and Inside Bar Narrow Range 4 & 7 Days.

See also:

Sunday, September 8, 2024

Toby Crabel’s "Bull Hook" Trading Strategy Tested | Ali Casey

As an algo trader, I value patterns for their ease of programming and testing, which allows for the development of robust trading strategies. Today, we'll explore bull and bear hooks, patterns that can vary in details but generally serve to catch traders on the wrong side. Toby Crabel, Joe Ross, and Thomas Bulkowski, among others, have variations of these patterns.

Toby Crabel's original definition of the Bull Hook pattern:
» A Bull Hook occurs on Day 2. A Bull Hook is defined as a day with a higher open than the 
previous day's high followed by a lower close with a narrowing daily range. The next day (Day 1), 
a trade is taken on the initial move off the open, preferably to the upside. «
 
Toby Crabel's original definition of the Bear Hook pattern:
  » Bear Hook is a day in which the open is below the previous day's low and the close 
is above the previous day's close with a narrow range relative to the previous day. As implied by 
the name there is a tendency for the price action following a Bear Hook to move to the downside. «

The Bull Hook pattern has two main forms:

Bull Hook 1: In a downtrend, the pattern is identified when today's bar is an up bar with a smaller range than the previous day and is an inside day (high lower, low higher than the previous bar). We buy with a stop order above the high of this bar.
Bull Hook 2: Here, today's bar is a down bar with a smaller range than the previous day, opening above the previous high and closing below the previous close. This pattern involves just two bars.


For testing, I used TradeStation with S&P 500 e-mini futures data. The backtest for Bull Hook 1 was disappointing, showing a loss with only 15 trades, which seemed unusual given its pullback nature. A deeper analysis suggested that the specific conditions, particularly the inside day and green bar requirements, were limiting trades. By removing some conditions, like the inside day and green bar, and focusing on a simpler pullback strategy, the results improved significantly with about 200 trades and positive performance metrics. 
 
For Bull Hook 2, the test also yielded fewer trades than expected, which might be attributed to its breakout nature, not performing well on the S&P 500. Simplifying the conditions here also improved the results somewhat, though it remained less effective. The Bear Hook pattern, when flipped for long trades, performed better but still had a low trade count. Removing some conditions and simplifying it increased the trade count and improved performance. 
 
While both Bull Hook patterns had potential, their effectiveness was highly dependent on specific conditions and the number of trades generated. Simplifying the patterns often led to better results.

Friday, August 23, 2024

Recent Toby Crabel Price Pattern Setups in the E-mini S&P 500 Futures


Wednesday, June 26, 2024

2-Bar Narrow Range Setup | Toby Crabel

2-Bar Narrow Range (2BNRrepresents a condensation of the market concept called congestion or contraction. Contraction is subsumed within the market Principle of Contraction/Expansion which states that the market, having a specific nature, is constantly changing from a period of movement to a period of rest and back to a period of movement. This interchange between the phases of motion and rest are constantly taking place with one phase directly responsible for the other's existence. 2-Bar NR represents this market principle and provides a means of quantifying contraction in any market environment. This is possible because of the open-ended nature of the concept 2-Bar NR. 
 
 2-Bar Narrow Range (2BNR) in the S&P 500 on June 26, 2024.
If the 2-bar range is the narrowest range from high to low of any two day period relative to
any two day period within the previous twenty days, we are sitting on a 2BNR trading setup for June 27.

Because it is not dependent on a constant measurement it represents contraction in a volatile or narrow market period. In other words, contraction is a relative condition that can occur even in a volatile market. Once a market concept is formulated it is tradable. An ORB (Opening Range Breakout) trade is taken the day after the 2-Bar NR formed. An ORB trade is entered at a predetermined amount above or below the opening range (stretch), that is the range of prices that occur in the first 30 seconds to 5, 15 or 30 minutes of trading. 
 
The assumptions are that with a contraction of this type trending action would follow the direction of the breakout, and that because this pattern exhibits a more defined contraction that trending would take place over the next several days also. It is advantageous if the 2-Bar NR is holding at an important angle of support/resistance, including trendlines, when it is formed. Once the market has moved away from the open in one direction after a 2-Bar NR, it should not return to the opening price. If it were to do so, that would disqualify the day as a trend day. Trending action is ideal and is expected after the pattern.
 
Reference:

Friday, June 14, 2024

The Principle of Contraction/Expansion | Toby Crabel

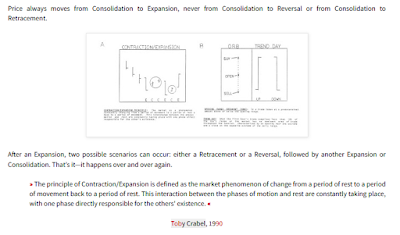
Price always moves from Consolidation to Expansion, never from Consolidation to Reversal or from Consolidation to Retracement. 
 

After an Expansion, two possible scenarios can occur: either a Retracement or a Reversal, followed by another Expansion or Consolidation. That’s it—it happens over and over again. 

» The principle of Contraction/Expansion is defined as the market phenomenon of change from a period of rest to a period of movement back to a period of rest. This interaction between the phases of motion and rest are constantly taking place, with one phase directly responsible for the others' existence. «
 
Toby Crabel, 1990
 
In his study 'Day Trading with Short Term Price Patterns and Opening Range Breakout' Toby Crabel defined the following range contraction and expansion patterns:

NR4 - The narrowest daily range relative to the previous three day’s daily ranges compared individually.
NR7 - A day with a daily range that is narrower than the previous six day’s daily ranges compared individually.
WS4 - (Widespread 4) A day with a daily range that is larger than any of the previous three day’s daily ranges.
WS7 - (Widespread 7) A day with a daily range that is larger than any of the previous six day’s daily ranges
             compared individually.

His key findings were: A cumulative total of Gross Profits for the contraction patterns vs expansion patterns on trades in the direction of the move off the open showed $710,000 for contractions on 7,313 trades and $102,000 for expansions on 7,524 trades. Profits were seven times larger for ORB (Opening Range Breakout) trades after contractions than expansions.

» Clearly something is going on here. The suggestion from these results is that one should be looking to go with a forceful move off the open after a contraction and not willing to do so after an expansion. In fact, fading price action off the open, with trend, after an expansion is a consideration. Other patterns can help with the decision on whether to fade a move off the open along with previously mentioned market context. If nothing else, one should be aware of the dangers of ORB trades the day after a big directional day. Caution is necessary after expansions. This is when the most attention is given to the market by the novice trades who invariably get caught in whipsaws and trendless markets. «  

 The more defined the congestion area, the better the chances for a Trend Day activity the following day.

Bitcoin - Inside Bar Narrow Range 4 (ID/NR4) in monthly, weekly, daily and 4 hour bar charts.

» An object at rest stays at rest and an object in motion stays in motion with the same speed 
and in the same direction unless acted upon by an unbalanced force. «
Isaac Newton's 'First Law of Motion', 1687
 

Sunday, June 9, 2024

An Outside Look at Inside Days | Larry Williams

First, lets define what constitutes an inside day. An Inside Day is exactly the opposite of an Outside Day. That is, today’s high is less than yesterday’s high and today’s low is greater than yesterday’s low. Hence the terminology inside day, as all of today’s price range or trading activity took place inside of yesterday’s range. An inside day is usually thought to be an indication of congestion. A price could not exceed the previous day on the upside nor could it break below the previous day’s low on the downside.

 » Inside Days are one of the most reliable forecasting patterns to occur in the marketplace. «
 
Chartists and authors have not paid very much attention to the inside days over the years. They have made note of them, but this is the first time, to my knowledge, that anyone has made a serious study of the impact of inside days. And, wouldn’t you just know it … inside days are one of the most reliable forecasting patterns to occur in the marketplace!

  » In a study of nine major commodities covering 50,692 trading sessions, I noted 3,892 inside days,
suggesting we will see these days appear about 7.6 percent of the time. «
Larry Williams, 1998.

There does seem to be some validity to this. The following chart shows what happens when we have an inside day with a down-close while prices are lower than they were 10 days ago. In the Standard and Poor’s, 71% of the time you were higher the next day. This may not even be as significant as the fact that 71% of the time you were higher 20 days after this occurrence. In the Value Line, price is higher 50% of the time after the occurrence, and in Treasury Bonds it’s higher 75% of the time. The pattern in Silver was not nearly as bullish, which surprises me because I had used this trading technique in Silver with some success … which just goes to show you! In Silver, on 36% of the time you were higher 20 days following the occurrence of the pattern. Soybeans were higher 57% of the time, Bellies 50% of the time and the Swiss Franc, where so far we have not found a pattern that forces prices higher, you were up only 22% of the time.

'Inside Days in the S&P 500' - Toby Crabel, 1990.

For a moment though, let’s take a look at just the occurrence of an inside day. What happens when we simply have an inside day with a down-close? Does that, on its own merit, forecast any significant market activity? The results are on the next few pages [of 'The Future Millionaire's Confidential Trading Course']. What can you find?

Then there’s the other side of this coin. What happens if we have an inside day with an up-close? Does this forecast positive action? It appears that it does to some extent. Study the tables for yourself. I have gone to the computer to give you the results for almost all possible configurations of the inside days. While, quite frankly, much of the data suggests random-gibberish-behavior, others are relationships that you can find and successfully trade with. What you need to focus on here is not that the patterns will always work for you, but that patterns, like methods, systems and tools, will give you the much needed odds that lead to successful speculation.
 
I have not exhausted all possible ways of looking at inside days with down-closes, though I have looked at the majority of the relationships one can study. There are others. As an example, what happens if the prices are higher, or if prices are lower following an inside day five days later. Does that mean that the down trend will continue? One could also ask the questions about an outside day following an inside day. Is this a particularly bullish pattern? (It is.) As you can see, your opportunity for research here is unlimited. If you have a computer, some data, and a desire to study the markets, here is fertile ground for you to come up with your own great ideas.