Floor Trader Pivots have been around for a long time and many traders have used these pivots to master the market for decades. Larry Williams re-popularized the formula by including it in his book, How I Made One Million Dollars Last Year Trading Commodities (1979). He described the "Pivot Price Formula" that he used to arrive at the next day's probable high or low. The concept of the Central Pivot Range was developed by Frank Ochoa (2010) based on Mark Fisher's Pivot Range (2002).

Here
is is one example of a trading strategy: Buy at the Central Pivot
Range's support in an uptrend and sell at resistance in a downtrend.
Filter all Floor Trader Pivots except S1, R2, and the central pivot
point when the market is in an uptrend. In a downtrend, all pivots are
filtered except R1, S2, and the central pivot point. If the market is
trending higher, one should look to buy at support at either S1 or the
central pivot range with the target set to a new high at either R1 or
R2.
Likewise, if the
market is trending lower, look to sell at resistance at either
R1 or the central pivot range with the target set to a new low at
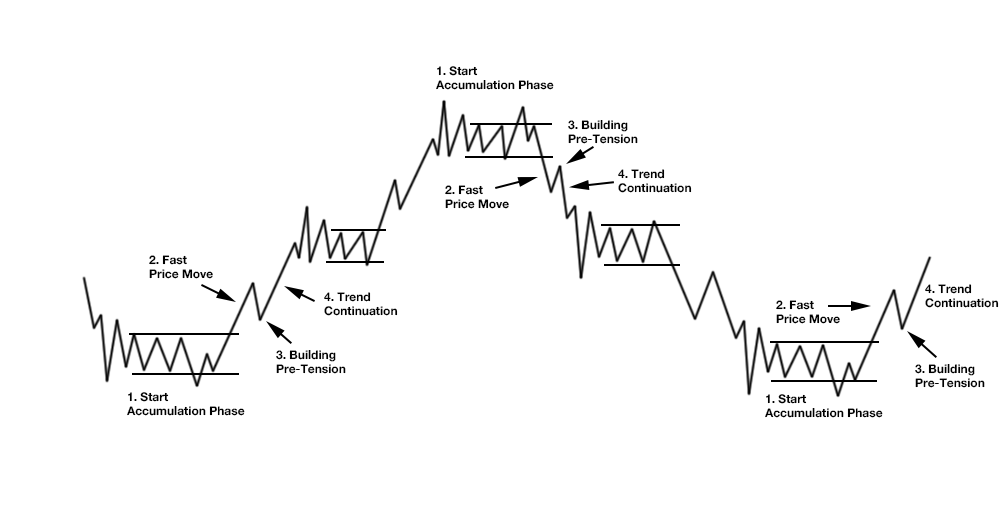
either S1 or S2. It takes a lot of conviction to break a trend and push
prices in the other direction, which means to be able to identify
the change in trend early enough, to profit from a very
enthusiastic price move, which can last a day, or even weeks. Once a
severe breach occurs through the first layer of the pivots, one
typically sees a shift of the trend toward the opposite extreme. That is,
a bullish trend becomes a bearish trend, and a bearish trend becomes a
bullish trend. Two key buying or selling zones, S1 and the central pivot
range in an uptrend, and R1 and the central pivot range in a downtrend.

CPR as a Magnet for Price - The
central pivot range (CPR) can have an amazing magnetic effect on price that
can lead to a high percentage fill of the morning gap. If price opens
the day with a gap and the centrals are back near the prior day's close,
you typically see a fill of the gap a high percentage of the time,
given the right circumstances. The central pivot point is reached 63 percent of the time at some point
during the day. When the market gaps at the open, the trade inherently
has a 63 percent chance of being a winner. Gaps that are too large don't
tend to fill as easily as those that are moderate in size. Pivot range
placement should be at, or very near, the prior day's closing price. If
the range is too close to price, however, it could hinder the market's
ability to fill the gap. Don’t wait all day for a gap to fill, because
the longer the trade takes, the more unlikely it is to fill. Gap fills
in general, seem to work best during earnings season. If price gaps up
to R1 resistance, or down to S1 support, these pivots can serve as a
barrier to a breakaway trade, which leads to a higher percentage of
filled gaps. A gap down requires much more confirmation, conviction, and
volume in order to fill the gap on most occasions.

Breakaway Strategy - When the market has formed a narrow-range day (NR4, NR7) in the prior session, the
pivots are likely to be tight, or narrow. Narrow pivots foster breakout
and trending sessions. If the market opens the session with a gap that
is beyond the prior day's price range and beyond the first layer of the
indicator, the chances of reaching pivots beyond the second layer of the
indicator increase dramatically. Price opened the day with a gap that
occurred beyond the prior day's price range and above R1 resistance.
When this occurs, one should study price behavior very closely in order
to determine if the pivot that was surpassed via the gap will hold. If
the pivot holds as support, you will look to enter the market long with
your sights set on R3 as the target. The third and fourth layers
are 30 percent more likely to be tested when price gaps beyond the first
layer of the indicator. When trading the Breakaway Strategy using the Floor
Trader Pivots, one should typically like to see the gap occur beyond the prior
day's range and value, preferably just beyond the first layer of the
indicator. In addition, the gap should occur no farther than the second
layer of the pivots.
CPR Width Forecasting -
Pivot Width is the distance between the top central pivot (TC) and the bottom central pivot (BC). Since the prior day's trading activity leads to the creation of today's
pivots, it is extremely important to understand how the market behaved
in the prior day in order to forecast what may occur in the upcoming
session. More specifically, if the market experienced a wide range of
movement in the prior session, the pivots for the following day will
likely be wider than normal, which usually leads to a Typical Day, Trading Range Day, or Sideways Day scenario. Conversely, if the market
experiences a very quiet trading day in the prior session, the pivots
for the following day are likely to be unusually tight, or narrow, which
typically leads to a Trend Day, Double-Distribution Trend Day, or Extended Typical Day scenario.

Pivot
width analysis works best when the range of movement is distinctly high
or low, thereby creating unusually wide or narrow pivots If the pivot
width is not distinctly wide or narrow, it becomes very difficult to
predict potential trading behavior with any degree of certainty for the
following session. An unusually narrow pivot range usually indicates the
market is primed for an explosive breakout opportunity. A tight central
pivot range can be dynamite. Be aware when a day has the
potential to start off with a bang. A day that has a wide range of
movement, like a Trend Day, will lead to the creation of an abnormally
wide pivot range for the following session. In this instance, you
typically see a quieter atmosphere in the market, as dictated by the
wide-set pivot range. Sometimes, a wide-set pivot range leads to nice
trading range behavior that allows you to pick off quick intraday swings
in the market, much like the Trading Range Day. The key to trading a
day when the centrals are wide is to identify the day's initial balance
after the first hour of trading. If the initial balance has a wide
enough width, you are likely to see trading range behavior within the
high and low of the first sixty minutes of the day. If the initial
balance coincides with key pivot levels, you have highly confirmed
support and resistance levels that offer great opportunities for
short-term bounces.
The
market has a much better chance to reach pivots beyond the second layer
of the Floor Pivots indicator if the central pivot range is unusually
narrow due to a low-range trading day in the prior session. Conversely, a
market is less likely to reach pivots beyond the second layer of the
indicator if the central pivot range is unusually wide due to a
wide-range trading day in the prior session.
CPR Trend Analysis
- Buying the dips means buying the pull-backs within an uptrend, while
selling the rips means selling (or shorting) the rallies within a
downtrend. One of the best ways to buy and sell pull-backs in a trend is
to play the bounces off the central pivot range, which is the method
many professionals use. A strong trend can usually be gauged by how
price remains above the bottom central pivot (BC) while in an uptrend,
and below the top central pivot (TC) while in a downtrend. Once price
violates this paradigm by closing beyond the range for the day, you see
either a change in trend or a trading range market develop. Pull-back
opportunities usually occur early in the session, with follow-through
occurring the rest of the day. Any pull-back to the range early in the
morning is a buying or selling opportunity depending on the direction of
the trend. Once in the trade, the goal is to either ride the trade to a
prior area of support or resistance, or to a new high or low within the
trend.

Two-Day CPR Range Relationships - Understanding how the current central pivot range relates to a prior day's CPR will go a long way toward understanding current market behavior and future price movement. Where the market closes in relation to the pivot range gives you an initial directional bias for the following session. The next day's opening price will either confirm or reject this bias Higher Value relationship. Current day's pivot range is completely higher than the prior day's pivot range.

Two-Day Unchanged CPR Range = Sideways or Breakout Bias - The
current pivot range is virtually unchanged from the prior day's range.
Of the seven two-day relationships, this is the only one that can
project two very different outcomes, posing a bit of a dichotomy. On the
one hand, a two-day neutral pivot range indicates that the market is
satisfied with the facilitation of trade within the current range. When
this occurs, the market will trade quietly within the boundaries of the
existing two or three day trading range. On the other hand, however, a
two-day unchanged pivot range relationship can indicate the market is on
the verge of a major breakout opportunity, similar to when the market
has formed two, or more, points of control that are unchanged. The
outcome is typically driven by the opening print of the current session.
If the market opens the day near the prior session's closing price and
well within the prior day's range, the market will likely lack the
conviction necessary for a breakout attempt. If the opening print occurs
beyond the prior day's price range, or very close to an extreme, the
chances are good that a breakout opportunity may lie ahead.
 |
| Daily CPR Width and Range Relationships. |
Outside CPR Range = Sideways Bias -
This happens when the current day's pivot range completely engulfs the
prior day's range. This two-day relationship typically implies sideways
or trading range activity, as the market is happy with the current
facilitation of trade in the current price range. A wide range will
usually indicate trading range behavior This relationship is much more
telling if the current day's pivot range is significantly wider than the
prior day's range. Otherwise, merely engulfing the prior day's range
without the necessary width may lead to the same result, but with less
accuracy.
Inside CPR Range = Breakout Bias -
It occurs when the current day's pivot range is completely inside the
prior day's range. This two-day relationship typically implies a
breakout opportunity for the current session, as the market is likely
winding up ahead of a breakout attempt. If the market opens the day
beyond the prior day's price range, there is a very good chance that
initiative participants will enter the market with conviction in order
to push price to new value. If the market opens the day within the prior
day's price range, a breakout opportunity could still be had, but with
much less conviction. This two-day relationship doesn't occur
frequently. On the days when it develops, usually lead to major trending
sessions. If the prior day's pivot range is noticeably wider than the
inside day pivot range, you are more likely to see a breakout
opportunity, especially if the current day's pivot range is very narrow.
If both pivot ranges are virtually the same width, but technically meet
the inside requirement, the rate of success will noticeably drop.
 |
| Daily CPR Width and Range Relationships and Floor Trader Pivot Levels. |
Higher CPR Range = Bullish Bias - Current day's pivot range is completely higher than the prior day's pivot range. The most bullish relationship of the seven two-day combinations Initial directional bias will be bullish. However, how the market opens the day will either confirm or reject this initial bias. If the market opens the day anywhere above the bottom of the pivot range, you will look to buy a pull-back to the range ahead of a move to new highs. This is especially the case if price opens above the top of the range. As long as the market opens the following day above the bottom of the pivot range, but preferably above the top of the range, any pull-back to the range should be seen as a buying opportunity.
Lower CPR Range = Bearish Bias
- It occurs when the current day's pivot range is completely lower than
the prior session's range. This is the most bearish two-day
relationship and typically leads to further weakness should the current
day's opening price confirm the directional bias. If price opens the
session below the central pivot range, you will look to sell any
pull-back to the range ahead of a drop to new lows within the current
trend. If price opens the following session below the top of the pivot
range, but preferably below the bottom of the range, any pull-back to
the range should be a selling opportunity. It must be reiterated,
however, that just because a two-day relationship implies a certain
behavior in price, this bias must be confirmed by the opening print.
While a Lower Value relationship is the most bearish two-day
relationship, perhaps the biggest rallies occur when the opening print
rejects the original bias.
Overlapping Lower CPR Range = Moderately Bearish Bias - The current day's bottom central pivot is lower than the bottom of the prior day's range, but the top of the current day's range is higher than the bottom of the prior day's range.It indicates a moderately bearish outlook for the forthcoming session. If price opens within or below the pivot range, price should continue to auction lower. Any pull-back to the range should be seen as a selling opportunity.
 |
| Weekly CPR Width and Range Relationships. |
References:


%20-%20Price%20and%20Market%20Structures%20-%20Summary%20%5B2%20p.%5D-1.png)
%20-%20Price%20and%20Market%20Structures%20-%20Summary%20%5B2%20p.%5D-2.png)