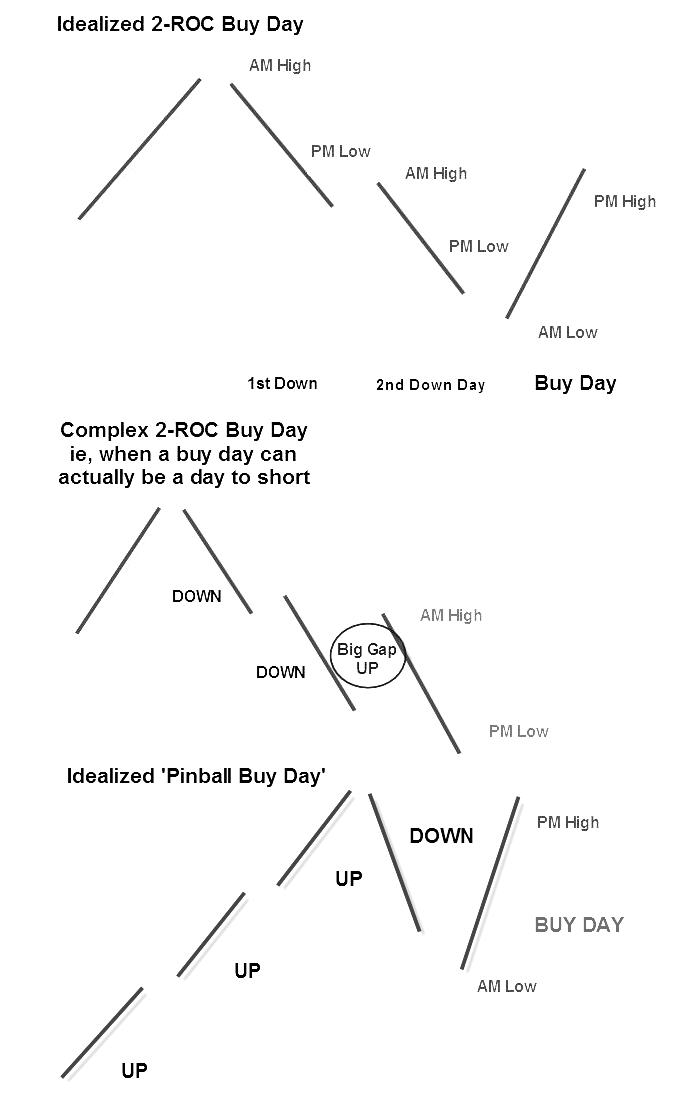
A typical pattern of behaviour particularly when examining the Three Day Cycle is to be able to identify a peak high followed by three moves down and a reversal which forms the peak low. Each time price moves down a level they can be referred to as achieving or making either a Level I, Level II or a Level III move. Level I and Level II have relatively similar patterns of behaviour (1-2-3 stop hunt). However Level III tends to be choppy with a wide range and represents an area of profit-taking for the institutions and signifies the beginning of an accumulation period for another cycle.
The reasons for this behaviour can be understood if you consider what happens during the rundown:
- On day one the retail traders are selling and the institutions buying from the retail traders.
- On day two the retail traders are selling and again the institutions are buying.
- However, on day three the retail traders are again interested in selling and the institutions are buying up heavily.
- Now price moves up aggressively triggering stops and taking a profit. (In effect, the market makers are using a scaling-in method to book their profit).
- Following a Level III pullback price becomes choppy and continues because of what happens with the trader’s psychological adaptation to loss. After the market has run down for three days and traders have taken losses, these individuals react by pulling away from the market quite literally and having a few days off before coming back to trade. During this period the market is choppy and relatively stagnant until the traders have returned to play in the game again.
- "After a big drop the market must chop"
- "After three days of drop the market must chop"
- "After a big rise the market needs more guys"
- "After three days of rise the market needs more guys"
Count the levels to know what part of the cycle price is currently in. Entering trades at peak reversals is best. One should only take a long position when the Low of the Day (LOD) or High of the Day (HOD) is clear. This is the only place that has a high level of certainty in directional movement. Look for a midweek reversal which will generally correlate with one or both of the intraday reversals. With an awareness of the longer cycle and assuming one is in the correct place within the cycle, it is possible to convert a spot trade to a swing trade from one of the 3 day cycle peaks to the other given an appropriate entry. This would involve going from one peak formation high to the next peak low and may take several days.
On an intraday trade, it is still important to understand the current position within this larger cycle. This will help to make a judgement about how far a run may last. For example, if price has just passed the peak high and is at a Level I accumulation then an intraday long trade after a bearish stop hunt, while valid, will not be likely to produce consistent results. Hence, it is a good idea to not take trades against the longer trend at a Level I accumulation.

The Accumulation Phase: This phase commences with the resetting of a daily high/low. It occurs at 5pm ET which is the beginning of the “Dharma” period. The Dharma period occurs after the US markets have closed and before the London markets have opened. During this period there tends to be little activity and the market just cycles back and forth between two price points. This occurs because Bank A will buy a quantity of currency from Bank B [1]. This causes price to rise. This is followed by bank B selling the same currency to Bank C [2] and this causes price to fall. This process goes around in circles and so the price simply oscillates back and forth. After a while, the range begins to widen [3]. This has the effect of triggering pending orders placed by breakout traders. So positions become committed and gradually accumulate as more and more traders begin to ‘take the bait’. However, when they are triggered, price is quickly pulled away and they will often be stopped out on the other side of the range which is also widening.

The Stop Hunt - also defining the HOD and LOD: Sometimes between 1 – 4am ET, the market makers make a stop hunt. The stop hunt involves a deliberate movement outside of the range to what will become the high or low of the day. The move usually occurs in three pushes which can be as simple as three candles though you will sometimes see a small pause in the form of a pullback in the middle of this. The stop hunt has two main objectives:
- Take out existing stops, that is: collecting buy side and sell side liquidity.
- Encourage traders to commit to positions in a direction that is opposite to where the real trend is going to be.
- The spread is opened up by a few pips. This allows traders orders to be triggered outside their normal boundaries and they will be holding negative positions from the outset.
- It is common to see price undergo a further period of accumulation lasting 30 to 90 minutes which encourages traders to take further positions. When there are enough positions, the price is moved in the direction of the true trend and their stops will be triggered.
- There is often a second move to the HOD/LOD though most of the time it will fail to take it out (so as to not give those who got in a profitable position to escape from). This forms the typical W or M pattern.

Other behaviors at the HOD and LOD Reversal: Market makers induce traders to take the wrong direction by using sharp and aggressive moves near the high or low of the day. One of the ways of identifying that you are in the right place is that the market will seem to be quiet, in consolidation and make a sharp move out of the range, faking "the breakout".
If a trade is taken in the area of the HOD/LOD one might notice that price is moving around but the position changes little. Looking at the price board one will see that it is "flickering red and blue" with lots of changes suggesting that there is lots of activity but in fact there is little and a reversal is imminent. Another observation during this period is that the spread widens. This is done so that a broader range of orders can be collected and accumulated during this period, making it even more difficult for traders to take profit as they are in a losing position right from the outset. The diagram below demonstrates what happens to the spread during this period.
If a trade is taken in the area of the HOD/LOD one might notice that price is moving around but the position changes little. Looking at the price board one will see that it is "flickering red and blue" with lots of changes suggesting that there is lots of activity but in fact there is little and a reversal is imminent. Another observation during this period is that the spread widens. This is done so that a broader range of orders can be collected and accumulated during this period, making it even more difficult for traders to take profit as they are in a losing position right from the outset. The diagram below demonstrates what happens to the spread during this period.

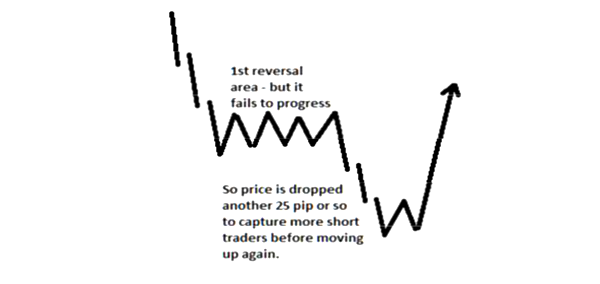
But these patterns do fail sometimes. This occurs when there has not been enough volume to make it worth their while to take a reversal. In these situations that price is moved to the next level to further induce positions to be taken in the wrong direction, against what is to become true trend. This is called the extended stop hunt.
Extended Stop Hunt: When price is pushed outside of the Asian range and comes to rest 25 to 50 pips beyond the range, the market makers' motivation is to generate a stop hunt. However, if as a result of this move the accumulation of positions is inadequate for their purposes, then the stop hunt will be extended. This means that price will be pushed beyond this Level in the direction of the technical trend in an effort to induce more traders to enter positions and build up the positions required.
Like before, this move will be in the 25 – 50 pip range and be comprised of 3 candles or 3 pushes. But also like before this is not necessarily the case and more or less are also possible. Again the trader must use their own judgement and discretion. Therefore, identifying that after a period of time the stop hunt has not led to a reversal one should scratch the trade. An appropriate period of time is 2 hours following the second leg of an M or W pattern. It the trader has not moved in the expected direction by this time, something is wrong and they have not been able to build up enough volume to make it worthwhile to reverse the market.
Like before, this move will be in the 25 – 50 pip range and be comprised of 3 candles or 3 pushes. But also like before this is not necessarily the case and more or less are also possible. Again the trader must use their own judgement and discretion. Therefore, identifying that after a period of time the stop hunt has not led to a reversal one should scratch the trade. An appropriate period of time is 2 hours following the second leg of an M or W pattern. It the trader has not moved in the expected direction by this time, something is wrong and they have not been able to build up enough volume to make it worthwhile to reverse the market.
The True Trend: The stop hunt is followed by a reversal and a slower trend that continues against the ‘faked’ trend toward the opposite high/low for the day. This trend tends to move in three waves, the pause between each wave representing a new opportunity to fake out traders by reversing direction and then moving against them again. These pauses are often characterized by sideways movement rather than a significant retracement though both are possible.

The Opposite LOD / HOD and Reversal: Ultimately the opposite LOD/HOD will be reached and there will be another reversal. This often occurs in the NY session, called the NYC Reversal Trade. This trade is likely to return a smaller profit than the initial stop hunt reversal trade though it is still worth taking particularly if you are not able to enter a trade following the London open.

Return to Accumulation: Once the reversal has occurred, price tends back toward the center, often not far from the starting point and recommences a new period of accumulation to lead into the new Dharma period and tomorrow’s cycle.

Quoted from:
Anonymous - The Market Maker Method
See also: