Jesse Livermore was born in 1877 in Shrewsbury, Massachusetts, to a poverty-stricken farmer family. He learned to read and write at the age of three-and-a-half. At the age of 14 his father pulled him out of school to help with the farm. However, with his mother's blessing, Livermore ran away from home to begin to live on his own behalf and responsibility aged 14 as a quotation board boy at a Boston stock brokerage business earning $5 per week. By 1923 Livermore was one of the richest people in the world. He was, he believed, particularly suited to his first job because of his strong abilities in mental arithmetic and number memorization.
 |
The 1870 census in the US found that 1 out of every 8 children below 14 years old
was a wage slave. By 1910 it was 1 out of 5. |
Stock and commodity prices came into his broker’s office on a ticker tape, a continuous strip of paper. It was Livermore’s job to read, to memorize and to transfer all the price numbers as they come in to the quotation board outside for all the broker’s different clientele crowds in and around the trading pits and lobbies to be seen and to animate them to act in that very specific foolish way they were expected to act: buying and selling and placing buy-, sell- and stop orders at certain levels. This is exactly what generates these constantly repeating tremendous opportunities, profits and cuts for the broker and for the invisible Composite Operator over there in New York and in Chicago. He realized that for the rest of his life his destiny became aligned to this information of the ticker tape and his ability to understand the message of the algorithm. Livermore literally saw patterns in the waves of numbers that flowed each day from the tape and aligned his activity accordingly. He began to write those numbers in his own notebook and tested himself, predicting the direction that different stock prices would take at certain levels, times and days.
 |
Patterns in the Waves of Numbers:
Arithmetic of the Pump and Dump. |
Price delivered by Composite Man for the broker through the broker to the broker's different clientele crowds. Livermore realized that scheme generates more profit than
any other business activity ever known to man. For the Composite Operator. Hence he aligned himself to the tune of the invisible Composite Operator's price algorithm coming in on the ticker tape from New York and Chicago. The
cumulative price range of all one minute price bars of any
instrument traded by any broker on any given day nowadays exceeds what is called The Average Daily Price Range by the factor of fifty.
Fifty times the so called average daily trading range during each and every single trading day. Up and down. Every day. Say the average daily price range of a
given instrument is 1,000, the cumulative price will range around 50,000 during any trading day. Up and
down. From balance to imbalance back and forth in this very specific manner and sequence through time and price.
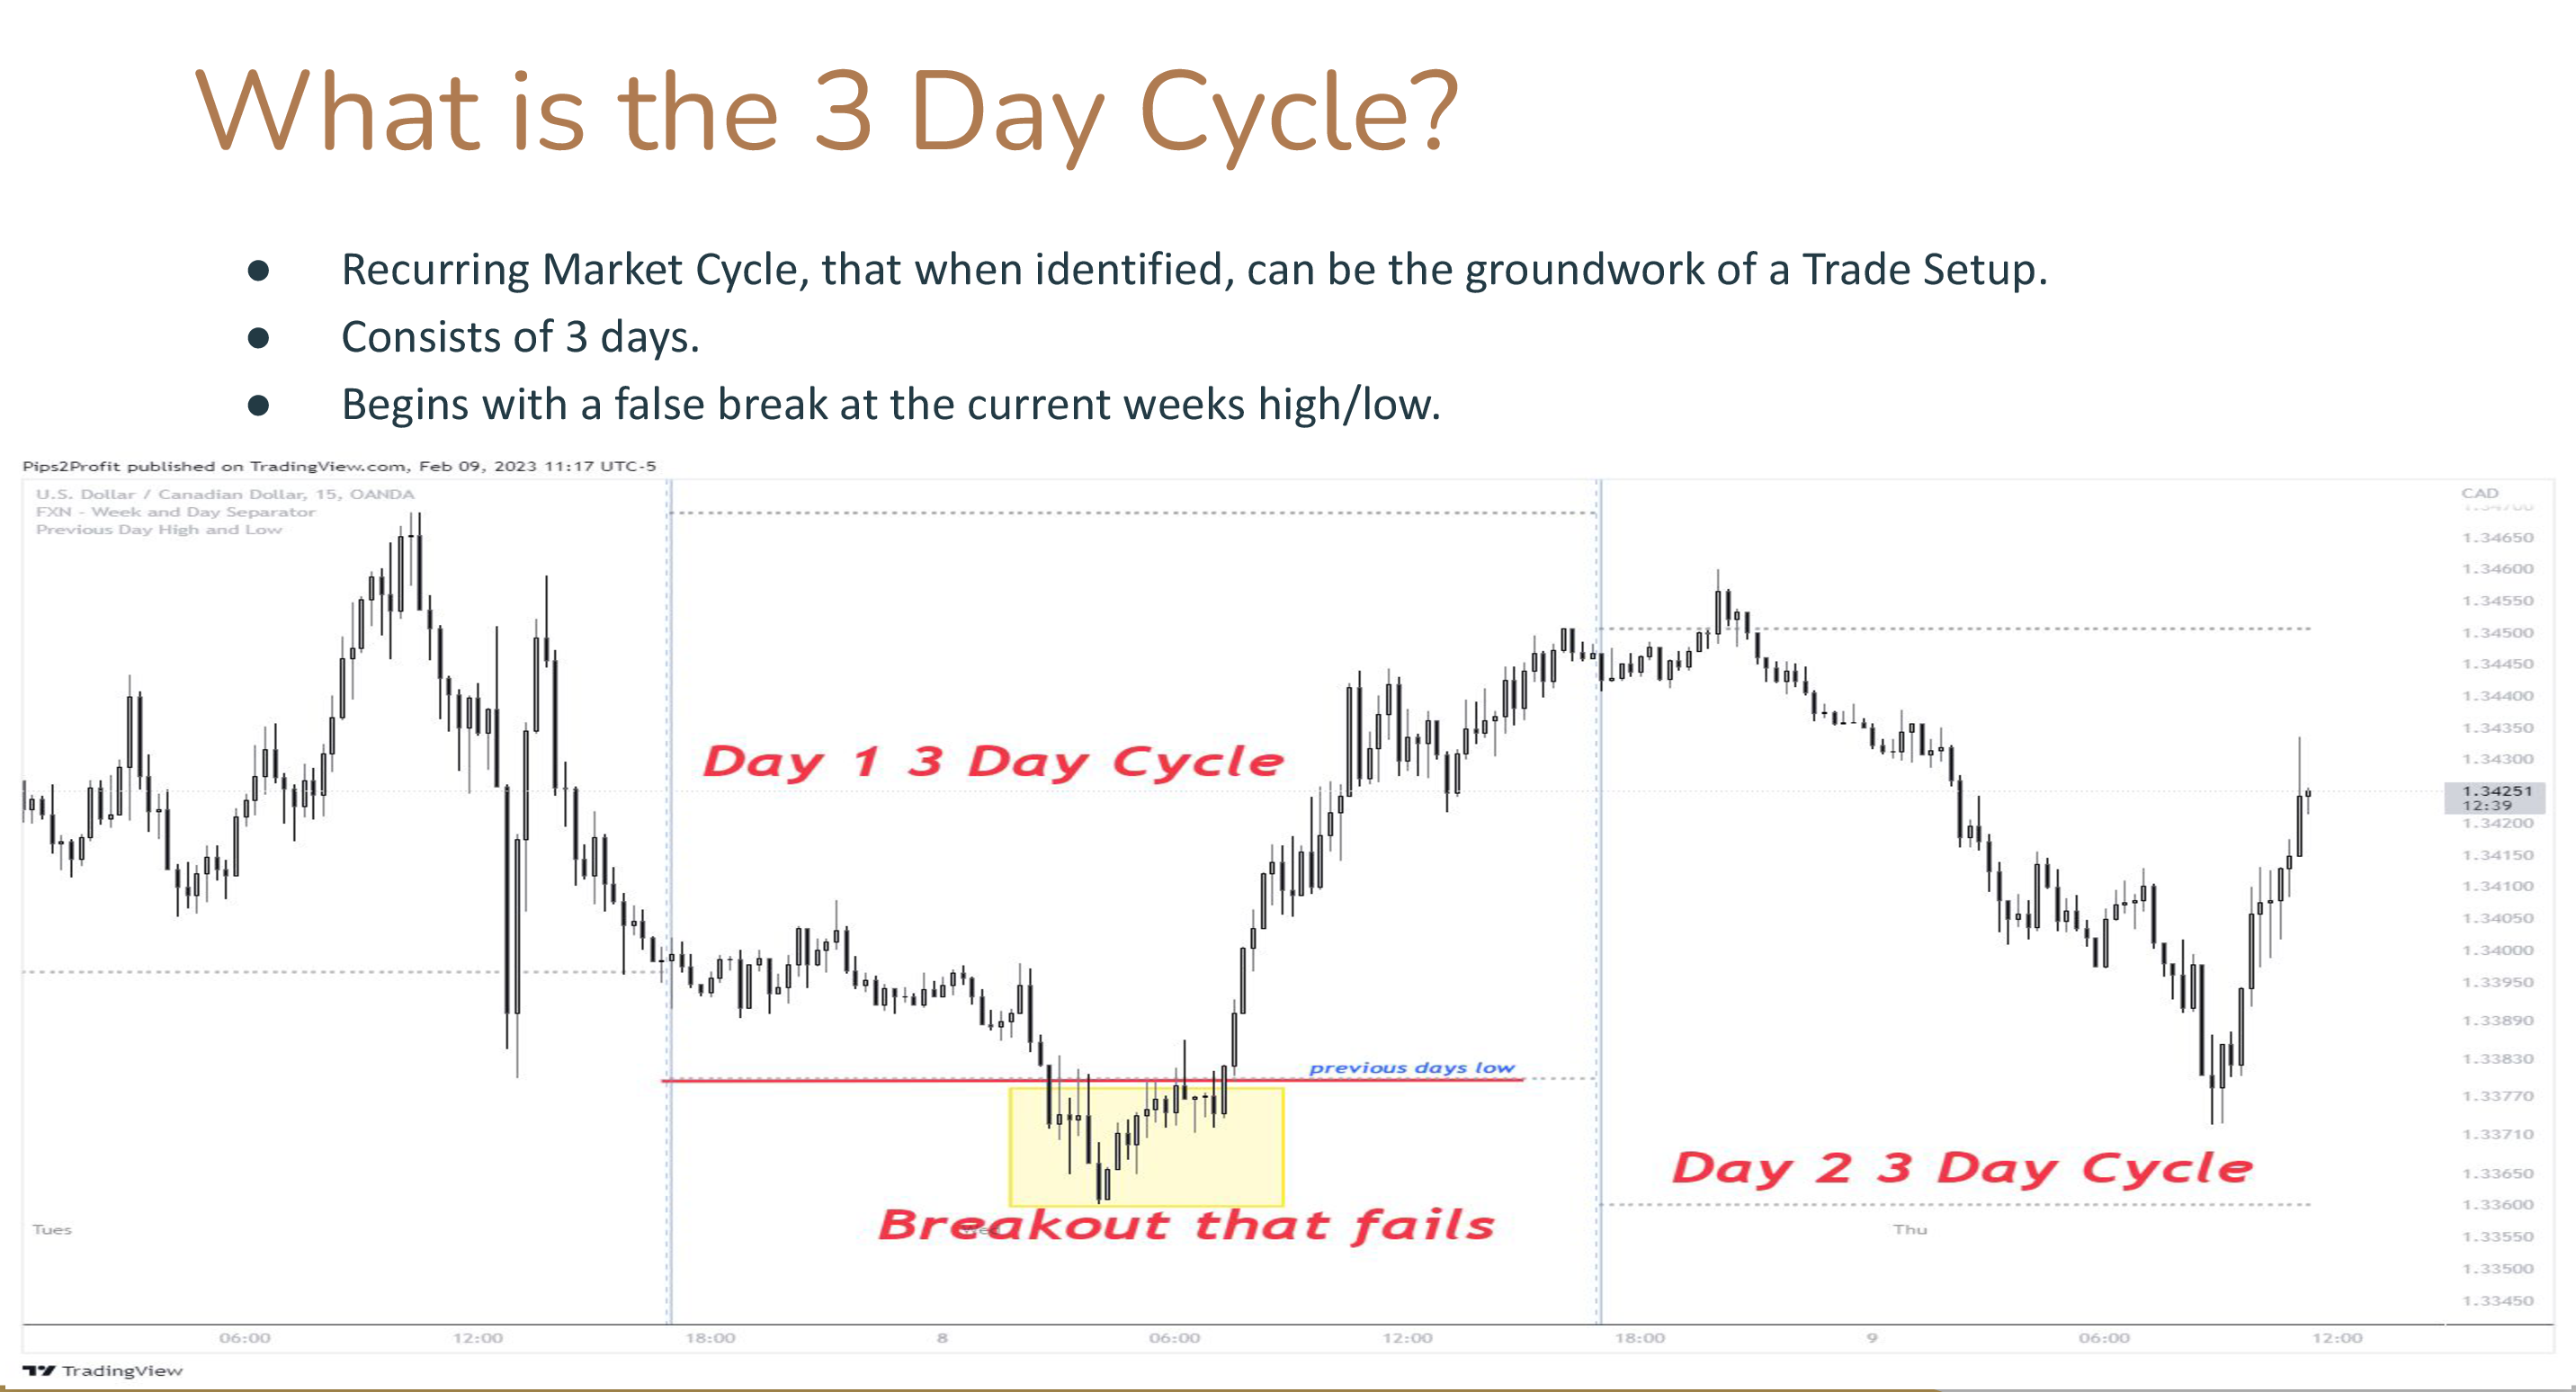
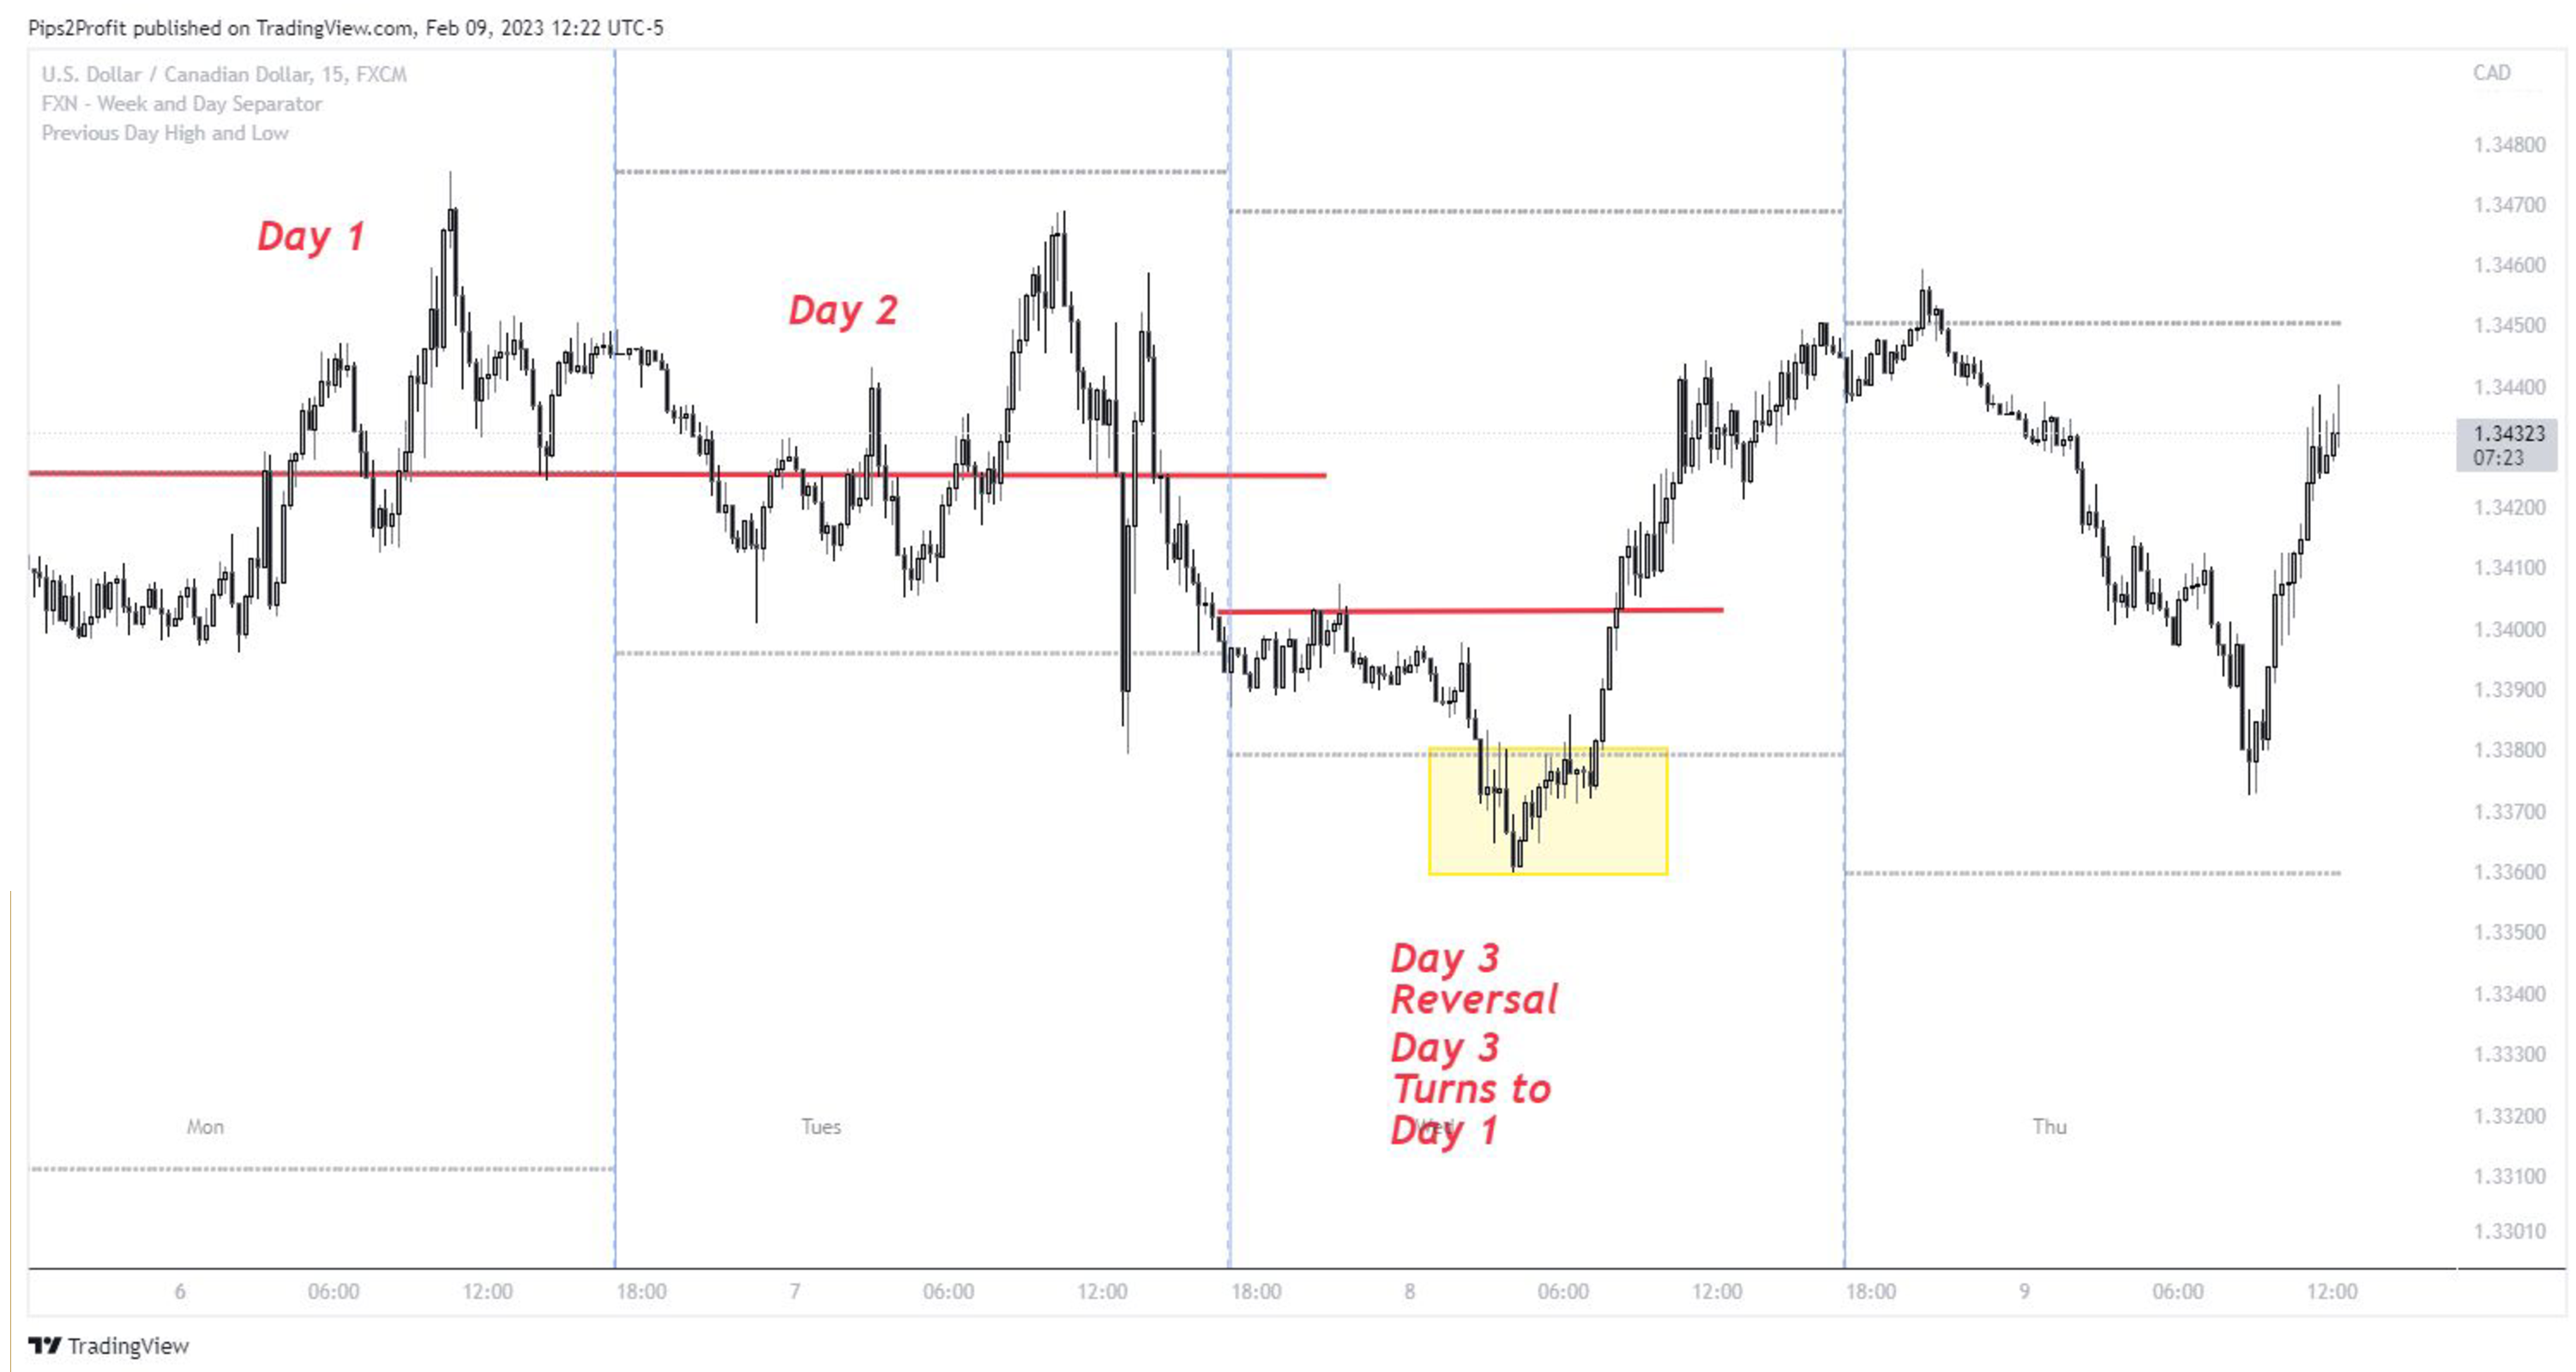
He used breakouts to a high degree of success. He would wait for price to break above a certain pivot level and then go long to ride on the emerging trend. Daily and weekly highs and lows, session highs and lows, measured moves and Floor Trader's Daily and Weekly Pivot Point Levels provide all clues for Livermore's pivotal levels. He would exit a trade only when a similar breakout occurs in the opposite direction, signifying a potential reversal in trend after a peak formation high or low, that is a change of structure and direction of price. If the reversal signal is strong enough, he would take a short trade and ride the bear market.
"Many years of my life had been devoted to speculation before it dawned upon me that nothing new was happening in the stock market, that price movements were simply being repeated, that while there was variation in different stocks the general price pattern was the same." Livermore used to say: "Whatever happens in the stock market today has happened before and will happen again".
In his notebook Livermore fills prices into columns headed Secondary Rally - Natural Rally - Up Trend - Down Trend - Natural Reaction, and Secondary Reaction.
 |
| Trend Change Rules |
Livermore’s
approach to swing trading required two filters: (1.) a larger swing filter
and (2.) a penetration filter of one-half the size of the swing filter. Penetrations were significant at price levels he called pivot points. A pivot point is defined in retrospect as the top and bottom of each new swing. The pivot points in the below swing chart are marked with letters. Positions are taken only in the direction of the major trend. A major uptrend is defined by confirming higher highs and higher lows, and a major downtrend by lower lows and lower highs, and where the penetration filter (swing filter) is not broken in the reverse direction. That is, an uptrend is still intact as long as prices do not decline below the previous pivot point by as much as the amount of the penetration filter. Once the trend is identified, positions are added each time a new penetration occurs, confirming the trend's direction. A stop-loss is placed at the point of penetration beyond the prior pivot point. Unfortunately Livermore never revealed how the penetration point was calculated. It seems however to be a percentage of the current swing size (e.g. 16%, 20%, 25%, 33%,50%) .
 |
| Failed Reversal in the Livermore Method |
In Livermore's system the first penetration of the stop-loss (a swing high or low depending on the direction of the trade) calls for liquidation of the current position. A second penetration is the necessary confirmation for the new trend. If the second penetration fails (at point K) it is considered a secondary reaction within the old trend. The downtrend may be re-entered at a distance of the swing filter below K, guaranteeing that point K is defined, and again on the next swing, following pivot point M when prices reach the penetration level below pivot point L. It is easier to re-enter an old trend than to establish a position in a new one.
This is Jesse Livormore's insight and conclusion:
- Markets are never wrong opinions often are. Back your judgment and don't trust your opinion, until the action of the market itself confirms your opinion.
- Few people ever make money on tips, beware of inside information. If there was easy money lying around, no one would be forcing it into your pocket.
- Money is made by sitting, not trading. It takes time to make money. Don't give me timing; give me time.
- Buy right, sit tight. Big movements take time to develop. Men who can both be right and sit tight are uncommon.
- Money cannot consistently be made by trading every day or every week during the year.
- Nothing new ever occurs in the business of speculating or investing in securities and commodities.
- Never average losses.
- The human side of every person is the greatest enemy of the average investor or speculator. Wishful thinking must be banished.
References:
Richard D. Wyckoff (1920) - Jesse Livermore's Methods of Trading in Stocks.
Jesse Thompson (1983) - The Livermore System. In: Technical Analysis of Stocks & Commodities.
Mark B. Fisher (2002) - The Logical Trader.
Richard Smitten (2005) - Trade Like Jesse Livermore.


%20-%20Trade%20Management%20%5B11%20p.%5D-04.png)
%20-%20Trade%20Management%20%5B11%20p.%5D-05.png)


