
The Sun and the Moon are in square aspect (90°) during the first and last quarters, in opposition (180°) at the Full Moon, and in conjunction (0°) at the New Moon. They are in sextile (60°) between the New Moon and the first quarter and between the last quarter and the New Moon. For precise work, compute a heliocentric chart for the times that the Moon, Earth, and Sun are in exact aspect. Unless there are other overshadowing influences, trines (120°) and conjunctions will be up, squares will be down, oppositions will be somewhat up, and sextiles can be either direction.

Most financial astrologers will tell you that oppositions (Full Moons) will sent the market down, but my experience does not verify this. Apparently, the momentum of being between two trines will carry the opposition along. If the next aspect following a sextile is a conjunction, the sextile is likely to correlate with an upward movement. But if the aspect following a sextile is a square, the sextile is likely to be accompanied by a downward-moving market.

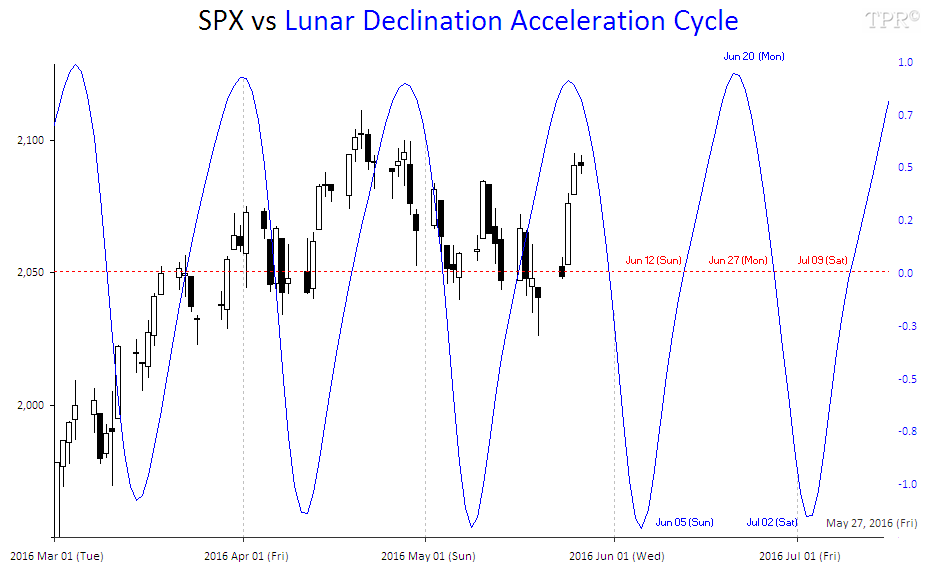
Another lunar cycle concerns the elements. The market tends to move up whenever the Moon is in an Air [Gemini, Libra, Aquarius] or Fire sign [Aries, Leo, Sagittarius] and to move downward whenever the Moon is in an Earth [Taurus, Virgo, Capricorn] or Water sign [Cancer, Scorpio, Pisces]. Other recent experiments have attempted to be the Moon's velocity and the angular rates of positive acceleration or negative acceleration to the market. These have been inconclusive.
Carol S. Mull (1989) - Mercury and the Dow. In: Traders World, #4915, Issue #15.
Ilia D. Dichev and Troy D. Janes (2003) - Lunar Cycle Effects in Stock Returns
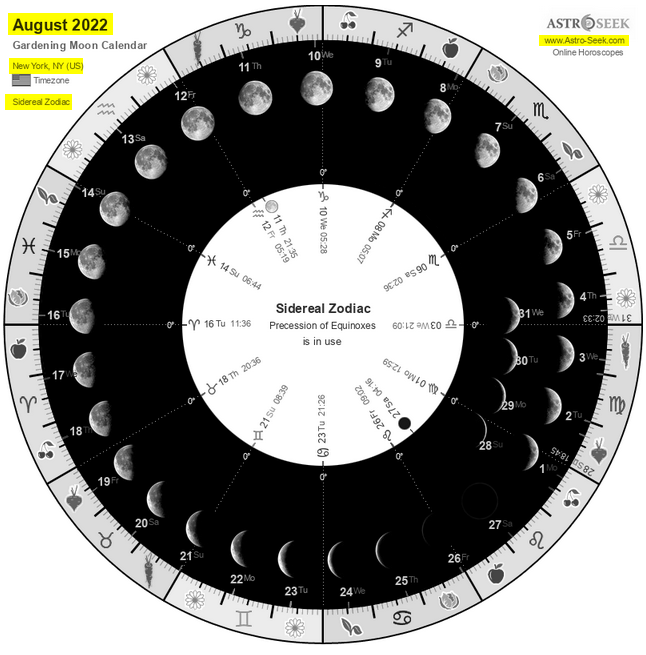
AstroSeek.com (2022) - Monthly Lunation Cycle
AstroSeek.com (2022) - Monthly Astro Calendar

 |
| HERE |
 |
| HERE |
 |
| HERE |


