
Showing posts with label Sun. Show all posts
Showing posts with label Sun. Show all posts
Sunday, February 23, 2020
Monday, December 23, 2019
S&P 500 Index vs Division of Solar Year 2020 starting from Earth’s Perihelion

32nd Harmonic of Solar Year 2020 | W.D. Gann's Natural Trading Days:
[ 1 Solar Year = 360 Degrees of the Sun's Geocentric Longitude / 32 = 11.25 Decimal Degrees ]
2019 Dec 02 (Mon) 07:39:34 = 326.25
2019 Dec 13 (Fri) 13:31:43 = 337.5
2019 Dec 24 (Tue) 18:40:56 = 348.75
2020 Jan 05 (Sun) 01:47:00 = 360 = Earth's Perihelion
2020 Jan 16 (Thu) 04:24:47 = 11.25
2020 Jan 27 (Mon) 09:35:44 = 22.5
2020 Feb 07 (Fri) 15:33:59 = 33.75
2020 Feb 18 (Tue) 06:45:01 = 45
2020 Feb 29 (Sat) 14:52:49 = 56.25
2020 Mar 12 (Thu) 00:40:14 = 67.5
2020 Mar 23 (Mon) 12:04:20 = 78.75
2020 Apr 03 (Fri) 09:00:56 = 90
2020 Apr 15 (Wed) 00:03:59 = 101.25
2020 Apr 26 (Sun) 16:47:04 = 112.5
2020 May 08 (Fri) 11:20:33 = 123.75
2020 May 19 (Tue) 14:47:34 = 135
2020 May 31 (Sun) 12:02:01 = 146.25
2020 Jun 12 (Fri) 10:27:23 = 157.5
2020 Jun 24 (Wed) 09:24:58 = 168.75
2020 Jul 05 (Sun) 16:01:47 = 180 = Earth's Aphelion
2020 Jul 17 (Fri) 15:21:55 = 191.25
2020 Jul 29 (Wed) 14:12:04 = 202.5
2020 Aug 10 (Mon) 12:24:10 = 213.75
2020 Aug 21 (Fri) 16:44:08 = 225
2020 Sep 02 (Wed) 12:28:40 = 236.25
2020 Sep 14 (Mon) 06:37:08 = 247.5
2020 Sep 25 (Fri) 22:55:17 = 258.75
2020 Oct 06 (Tue) 21:19:28 = 270
2020 Oct 18 (Sun) 10:04:18 = 281.25
2020 Oct 29 (Thu) 21:05:34 = 292.5
2020 Nov 10 (Tue) 06:30:12 = 303.75
2020 Nov 20 (Fri) 22:28:34 = 315
2020 Dec 02 (Wed) 05:16:15 = 326.25
2020 Dec 13 (Sun) 11:02:37 = 337.5
2020 Dec 24 (Thu) 16:08:14 = 348.75
2021 Jan 02 (Sat) 07:50:00 = 360 = Earth's Perihelion
Previous Year HERE
Saturday, November 30, 2019
S&P 500 vs True Lunar Node Speed | Exuberant Mood and Frenzy
 |
| The Lunar Node Wobble: Node @ 0 = Nov 29 (Fri), max Direct @ High = Dec 02 (Mon), @ 0 = Dec 04 (Wed), Mean @ -0.053 = Dec 07 (Sat), max Retrograde @ Low = Dec 09 (Mon), @ -0.053 = Dec 10 (Tue), @ 0 = Dec 14 (Sat), @ High = Dec 17 (Tue), @ 0 = Dec 19 (Thu), @ Low Dec 23 (Mon), Annular Solar Eclipse = Dec 26 (Thu), @ 0 = Dec 27 (Thu), @ High = Dec 27 (Sun), @ 0 = Dec 31 (Tue), @ Low = Jan 01 (Wed), @ 0 = Jan 03 (Fri), @ High = Jan 07 (Tue), @ 0 and Penumbral Lunar Eclipse = Jan 10-11 (Fri-Sat), @ Low = Jan 13 (Mon), @ 0 = Jan 18 (Sat), etc. |
Before and after Lunar and Solar Eclipses the True Lunar Node starts wobbling (e.g. Dec 26, 2019 (Thu) = Annular Solar Eclipse and Jan 10–11, 2020 (Sat-Sun) = Penumbral Lunar Eclipse), quickly moving back and forth, retrograde, stationary, direct (see Moon Wobbles in a NASA animation HERE). Financial markets correlate with this 4 to 14 Day Cycle of the retrograde-stationary-direct motion of the Lunar True Node. About every 86.655 days a so called Moon Wobble (lunar libration) occurs when the Sun is conjunct, opposite and square (0°, 90°, 180°, 270°) the Lunar Node (4 * 86.655 days = 1 Nodical Year or Eclipse Year = 346.62 days). The Node starts wobbling about two weeks before the exact event and remains unstable until about one week after. If coupled with Solar and Lunar Eclipses, the wobble-effect can be extended. And as the Sun approaches conjunction and opposition towards the Lunar Node, it's motion is almost blocked (speed at or near zero). Notably these periods go along with exuberant mood and frenzy, most of the times correlating with rallies or crashes in financial markets. Previous events and correlations HERE

Sunday, November 17, 2019

Saturday, November 16, 2019

Saturday, October 26, 2019
SoLunar Map | November - December 2019
 |
| Upcoming SoLunar Turn-Days into the end of 2019: Nov 01 (Fri), Nov 04 (Mon), Nov 08 (Fri), Nov 12 (Tue), Nov 15-16 (Fri-Sat), Nov 19 (Tue), Nov 23 (Sat), Nov 27 (Wed), Nov 30 (Sat), Dec 04 (Wed), Dec 08 (Sun), Dec 12 (Thu), Dec 15 (Sun), Dec 19 (Thu), Dec 22 (Sun), Dec 26 (Thu), Dec 30 (Mon), Jan 02-03 (Thu-fri). Polarization may flip. Previous SoLunar Maps HERE |
Saturday, August 31, 2019
SoLunar Map | September - October 2019
 |
| Polarization should flip over the weekend: Sep 03 (Tue) should be a market high, Sep 07 (Sat) a low, etc. Previous turn-days HERE |
Thursday, August 29, 2019
S&P 500 Index vs True Lunar Node Speed | August 2019
 |
| Lunar True Node Speed @ maxDirect = Aug 25 (Sun) Lunar True Node Speed @ Mean = Aug 29 (Thu) Lunar True Node Speed @ maxRetrograde = Sep 02 (Sun) Lunar True Node Speed @ Mean = Sep 05 (Thu) Lunar True Node Speed @ maxDirect = Sep 08 (Sun) |
Before and after Lunar and Solar Eclipses the True Lunar Node starts wobbling (e.g. on Jul 16-17, 2019), quickly moving back and forth, retrograde, stationary, direct. Financial markets correlate with this 4 to 14 Day Cycle of the retrograde-stationary-direct motion of the Lunar True Node. About every 86.655 days a so called Moon Wobble (lunar libration) occurs when the Sun is conjunct (e.g. on Aug 16, 2017), opposite and square (0°, 90°, 180°, 270°) the Lunar Node (4 * 86.655 days = 1 Nodical Year or Eclipse Year = 346.62 days). The Node starts wobbling about two weeks before the exact event and remains unstable until about one week after. If coupled with Solar and Lunar Eclipses, the wobble-effect can be extended. And as the Sun approaches conjunction and opposition towards the Lunar Node, it's motion is almost blocked (speed at or near zero). Notably these periods go along with exuberant mood and frenzy, most of the times correlating with rallies or crashes in financial markets. Previous charts HERE
Saturday, June 1, 2019
S&P 500 Index vs SoLunar Map | June 2019
 |
| Recent and upcoming SoLunar Turn-Days into early July 2019 are: Jun 03 (Mon), Jun 06 (Thu), Jun 10 (Mon), Jun 13 (Thu), Jun 17 (Mon), Jun 21 (Fri), Jun 24 (Mon), Jun 28 (Fri), Jul 02 (Sat), Jul 06 (Sat). Previous SoLunar Maps HERE |
Monday, May 13, 2019

Saturday, February 2, 2019
SoLunar Map | February - March 2019

 |
| Recent and upcoming SoLunar Turn-Days into early April 2019 are: Feb 01 (Fri), Feb 04 (Mon), Feb 08 (Fri), Feb 12 (Tue), Feb 15 (Fri), Feb 19 (Tue), Feb 23 (Sat), Feb 27 (Wed), Mar 02 (Sat), Mar 05-06 (Tue-Wed), Mar 09 (Sat), Mar 13-14 (Wed-Thu), Mar 17 (Sun), Mar 20 (Wed), Mar 24 (Sun), Mar 28 (Thu), Apr 01 (Mon). Previous SoLunar Maps HERE |
 |
| Review of S&P500 vs SoLunar Map | Preview for February 2019 |
Friday, January 4, 2019
S&P 500 Index vs Division of Solar Year starting from Earth’s Perihelion
 |
| 32nd Harmonic of Solar Year 2019 | W.D. Gann's Natural Trading Days: [ 1 Solar Year = 360 Degrees of the Sun's Geocentric Longitude / 32 = 11.25 Decimal Degrees ] 2019 Jan 03 (Thu) 12:19 [EST] = Earth's Perihelion 2019 Jan 14 (Mon) 17:41 = 11.25 2019 Jan 25 (Fri) 19:33 = 22.50 2019 Feb 06 (Wed) 01:22 = 33.75 2019 Feb 16 (Sat) 16:22 = 45.00 2019 Feb 28 (Thu) 00:30 = 56.25 2019 Mar 11 (Mon) 10:57 = 67.50 2019 Mar 22 (Fri) 22:14 = 78.75 2019 Apr 02 (Tue) 19:01 = 90.00 2019 Apr 14 (Sun) 09:42 = 101.25 2019 Apr 26 (Fri) 02:21 = 112.50 2019 May 07 (Tue) 20:36 = 123.75 2019 May 18 (Sat) 23:54 = 135.00 2019 May 30 (Thu) 21:04 = 146.25 2019 Jun 11 (Tue) 19:14 = 157.50 2019 Jun 23 (Sun) 18:17 = 168.75 2019 Jul 04 (Thu) 18:10 = 180.00 = Earth's Aphelion 2019 Jul 17 (Wed) 00:09 = 191.25 2019 Jul 28 (Sun) 23:09 = 202.50 2019 Aug 09 (Fri) 21:20 = 213.75 2019 Aug 21 (Wed) 01:59 = 225.00 2019 Sep 01 (Sun) 21:49 = 236.25 2019 Sep 13 (Fri) 16:10 = 247.50 2019 Sep 25 (Wed) 08:48 = 258.75 2019 Oct 06 (Sun) 07:16 = 270.00 2019 Oct 17 (Thu) 20:22 = 281.25 2019 Oct 29 (Tue) 07:33 = 292.50 2019 Nov 09 (Sat) 16:05 = 303.75 2019 Nov 20 (Wed) 08:20 = 315.00 2019 Dec 01 (Sun) 15:07 = 326.25 2019 Dec 12 (Thu) 21:02 = 337.50 2019 Dec 24 (Tue) 02:14 = 348.75 2020 Jan 05 (Sun) 02:21 = 360 = Earth's Perihelion |
Saturday, December 22, 2018
S&P 500 vs Planets under Fire | The Concept of Combustion
 |
| Indian astrology cultivates the idea that a planet in geocentric conjunction with the Sun is burned by the massive heat and fire, hence it combusts, is losing its luster and shine, and becomes powerless. The event is called combustion, and the affected planet becomes a combust planet. The Sanskrit word for combustion is kopa, meaning angry. However, the chart above extends this concept of combustion by the parallel of declination of planets and the Sun. A parallel aspect is formed between two planets with the same declination or distance north or south of the ecliptic. If the planets are both North or both South of the ecliptic, the parallel aspect is read as a conjunction. If they are the same declination but one is North and one is South, then the contra-parallel is read as a 180 degree opposition. These aspects are strongest when the orb is kept to 1 degree. They can also magnify the intensity of any other aspect between the two planets or points. Planets in geocentric conjunctions of longitude [000] and declination [#] with the Sun are: 2018 Oct 26 (Fri) 10:16 = SUN # VEN + SUN 000 VEN 2018 Nov 03 (Sat) 10:49 = SUN # VEN 2018 Nov 05 (Mon) 00:05 = SUN # MAR 2018 Nov 21 (Wed) 23:55 = SUN # JUP 2018 Nov 25 (Sun) 23:42 = SUN # MER 2018 Nov 26 (Mon) 01:33 = SUN # JUP + SUN 000 JUP 2018 Nov 27 (Tue) 04:14 = SUN # MER + SUN 000 MER 2018 Dec 02 (Sun) 18:33 = SUN # PLU 2018 Dec 07 (Fri) 11:00 = SUN # SAT 2018 Dec 31 (Mon) 07:37 = SUN # MER 2019 Jan 02 (Wed) 00:49 = SUN # SAT + SUN 000 SAT 2019 Jan 06 (Sun) 22:58 = SUN # SAT 2019 Jan 10 (Thu) 11:35 = SUN # PLU 2019 Jan 11 (Fri) 00:37 = SUN # JUP 2019 Jan 11 (Fri) 06:38 = SUN # PLU + SUN 000 PLU 2019 Jan 22 (Tue) 06:04 = SUN # VEN 2019 Jan 29 (Tue) 21:49 = SUN # MER + SUN 000 MER 2019 Feb 06 (Wed) 10:59 = SUN # MER 2019 Mar 04 (Mon) 10:51 = SUN # NEP 2019 Mar 06 (Wed) 20:00 = SUN # NEP + SUN 000 NEP 2019 Mar 14 (Thu) 21:46 = SUN # MER + SUN 000 MER 2019 Mar 18 (Mon) 11:24 = SUN # MER 2019 Mar 22 (Fri) 14:47 = SUN # CHI + SUN 000 CHI 2019 Mar 30 (Sat) 05:53 = SUN # CHI 2019 Apr 21 (Sun) 08:28 = SUN # URA 2019 Apr 22 (Mon) 19:07 = SUN # URA + SUN 000 URA 2019 May 21 (Tue) 09:06 = SUN 000 MER Previous correlations between the stock market and combustion events HERE |
Saturday, December 1, 2018
SoLunar Map | December 2018 - January 2019
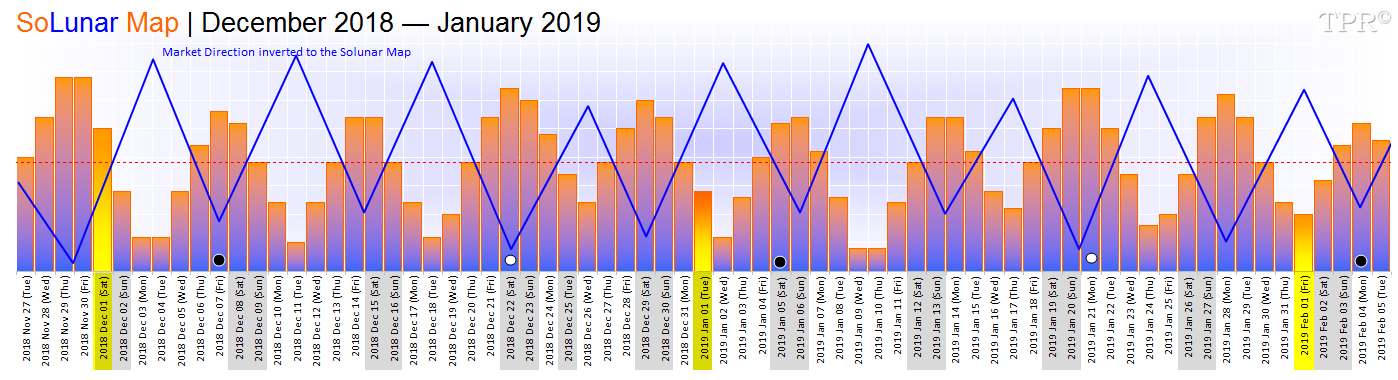 |
| Upcoming SoLunar Turn-Days are: Dec 04 (Tue), Dec 07 (Fri), Dec 11 (Tue), Dec 15 (Sat), Dec 18 (Tue), Dec 22 (Sat), Dec 26 (Wed), Dec 29 (Sat), Jan 02 (Wed), Jan 06 (Sun), Jan 09-10 (Wed-Thu), Jan 13-14 (Sun-Mon), Jan 17 (Thu), Jan 20-21 (Sun-Mon), Jan 24 (Thu), Jan 28 (Mon), Feb 01 (Fri). Previous SoLunar Maps HERE |

 |
| Review of S&P500 vs SoLunar Map during November 2018 | Preview for December 2018. |
Saturday, September 29, 2018
SoLunar Map | October - November 2018

 |
| Upcoming SoLunar Turn-Days are: Sep 28 (Fri), Oct 02 (Tue), Oct 06 (Sat), [Oct 08 (Mon) 22:08 = New Moon] Oct 09 (Tue), Oct 13 (Sat), Oct 17 (Wed), Oct 20 (Sat), Oct 24 (Wed) 14:26 = Full Moon, Oct 27 (Sat), Oct 31 (Wed), Nov 04 (Sun), Nov 07 (Wed) 09:23 = New Moon, Nov 08 (Thu), Nov 11 (Sun), Nov 15 (Thu), Nov 19 (Mon), Nov 23 (Fri) 02:10 = Full Moon, Nov 26 (Mon), Nov 30 (Fri), Dec 04 (Tue). Previous SoLunar Maps HERE |
 |
| Review of S&P500 vs SoLunar Map during September 2018 | Preview for October 2018. |
Sunday, August 5, 2018
S&P 500 Index vs Natural Trading Days | Cluster ± August 8-9 (Wed-Thu)
 |
| Aug 08 (Wed) = 90 TD from Apr 02 (Mon) Low + 180 CD from Feb 09 (Fri) Low + True Lunar Node Speed @ Max + MOO @ Max N-Declination Aug 09 (Thu) = 135 TD from Jan 26 (Fri) Major High + SUN 000 MER + VEN contra parallel SAT (heliocentric) + VEN 120 URA (h) + VEN 090 SAT (h). |
 |
| S&P 500 Index vs True Lunar Node Speed @ 0 and Extremes | 30 Day CIT Forecast |
Saturday, July 21, 2018
S&P 500 Index vs Lunar Year Cycle | Blood Moon Eclipse on July 27
 |
| The total phase of the "blood moon" eclipse on July 27 (Fri) will last 1 hour and 43 minutes and will be the longest total lunar eclipse of the 21st century. During the eclipse the Moon will turn into a spectacular red whilst the red planet Mars reaches opposition to the Sun on the very same day. Mars will appear brightest in the night sky from July 27 (Fri) to July 30 (Mon), and its closest approach to Earth will occur on July 31 (Tue). The wobble periods of the Moon during lunar and solar eclipses usually coincide with major highs and lows in financial markets, and the Lunar Year Cycle (354.36 Calendar Days) projects a low in the S&P 500 to August 8 (Wed) which is also 181 Calendar Days (or 184.74 solar degrees) away from the major low in stocks on February 8 (Thu), 2018. |
 |
| July 23-24 (Mon-Tue) Low and upturn, July 27 (Fri) High, and August 8 (Wed) Low in the S&P 500? |
 |
| Major Celestial Phenomena during late July and early August 2018. Source: NAO of Japan |
SoLunar Map | August - September 2018
 |
| This SoLunar Map depicts the bias for short-term movements of stock indices two months ahead. Of course financial markets are influenced also by other planetary forces, but a 3-5 day short-term rhythm and pattern is governed by the SoLunar forces (= 4 highs and 4 lows per lunar month). The soLunar forces are a composite of Sun-Moon angles, orbital eccentricities, declinations and some long-term cycles. A Low in the SoLunar Map frequently is a High in the stock market and vice versa. Inversions occur, and if so, they should occur only once every 4 lunar months around a New Moon (max +/- 7 days). The SoLunar Rhythm is frequently disturbed by (1.) the FED, and (2.) by sudden solar activity, altering the geomagnetic field, and hence the mass mood. This can result in the skip and/or inversion of pivots in the SoLunar Map. An increasing number of sunspots and flares have usually a negative influence on the stock market some 48 hours later, and vice versa (Ap values > 10 are usually short-term negative). A rising blue line in the SoLunar Map means the bias for the market is side-ways- to-up, and vice versa. Highs and lows in the SoLunar Map also may coincide with the start and termination of complex, side-ways correction patterns like zig-zags, triangles or flags. |
 |
| Upcoming SoLunar Turn-Days are: Jul 24 (Tue), Jul 27 (Fri), Jul 31 (Tue), Aug 04 (Sat), Aug 07 (Tue), Aug 11 (Sat) 04:23 = New Moon, Aug 15 (Wed), Aug 19 (Sun), Aug 22 (Wed), Aug 26 (Sun)) 09:46 = Full Moon, Aug 29 (Wed), Sep 03 (Mon), Sep 06 (Thu), Sep 09 (Sun) 12:24 = New Moon, Sep 13 (Thu), Sep 17 (Mon), Sep 21 (Fri), Sep 24 (Mon) [Full Moon = Sep 25 (Tue) 00:39], Sep 28 (Fri), Oct 02 (Tue). Previous SoLunar Maps HERE |
 |
| Review of S&P500 vs SoLunar Map during July 2018 | Preview for August 2018. Recent and upcoming SoLunar Turn-Days: Jul 31 (Tue), Aug 04 (Sat), Aug 07 (Tue), Aug 11 (Sat), Aug 15 (Wed), Aug 19 (Sun), Aug 22 (Wed), Aug 26 (Sun), Aug 29 (Wed), Sep 03 (Mon). |
Tuesday, July 3, 2018
Fourth of July | A Masonic Holiday

The Eye of Horus, the Eye of Providence or the All-Seeing Eye of God inside a triangle surrounded by the glow of Sirius, the Blazing Star of masonry (on the gate of Aachen Cathedral, Germany) is also part of the reverse side of the Great Seal of the United States.
Independence Day on 4th of July is
commonly associated not with masonry but with fireworks, parades,
barbecues, baseball games, family
reunions, political speeches and ceremonies. However, the legal separation
of the Thirteen Colonies from Great Britain in 1776 actually occurred on July 2nd,
when the Second Continental Congress voted to approve a resolution of
independence that had been proposed in June by Richard Henry Lee of Virginia
declaring the United States independent from Great Britain's rule. After voting
for independence, Congress turned its attention to the Declaration of
Independence, a statement explaining this decision, which had been prepared by
a Committee of Five, with Thomas Jefferson as its principal author. Congress
debated and revised the wording of the Declaration, finally approving it two
days later on July 4th. It was read from the balcony of the Council chamber of
the State House to the citizens of Philadelphia on July 8th 1776. So why do
the United States celebrate the 4th of July? Since many of the founding fathers
were enlightened masons (illuminati) of the Ancient and Accepted Scottish Rite, and freemasonry is rooted in ancient
mystery schools of solar worship, of course the date of the American Declaration of Independence was not arbitrary: In
1776 the solar aphelion (greek apo = from
+ helios = Sun = aphelion = away from the Sun) and the conjunction of the Sun with
Sirius both happened to occur on July 4th.
 |
| Independent farthest from the Sun (aphelion): 2018 Jul 06 (Fri) 12:46 2019 Jul 04 (Wed) 18:10 2020 Jul 04 (Wed) 07:34 Sun conjunct Sirius: 2018 Jul 03 (Tue) 02:00 2019 Jul 03 (Wed) 07:41 2020 Jul 02 (Thu) 13:31 |
 |
| The Washington Monument is constructed within a Vesica Pisces that is created by the orbiting bodies of our Sun and Sirius. |
 |
| The presidential inauguration ceremony performed once every four years at exactly high noon and 19.5 days into the new year on the balcony of the U.S. Capitol (the ever pregnant belly of Isis) facing the Washington Monument (the erect phallus of Osiris) is giving birth to the next U.S. president. |
The esoteric foundation of the United States as well as that of the entire modern Western world rests upon this ancient Egyptian astro-theology. It is therefore important to understand that Egypt became Greece, Greece became Rome, Rome became Venice, Venice became Amsterdam and England, and England finally became the imperial United States or the latest incarnation of ancient Egypt. True, if there is an actual guiding intelligence to man's evolution, it most certainly should be associated with Sirius. And the United States, with its natal Sun conjunct Sirius, would represent the clearest channel for this extra-human agency to manifest its will, whatever that may be. However, for those assuming that supernatural guidance was America's eternal fate and triumph, it might be wise also to recall that so far all empires have had an expiration date: Regardless of financial strength, political power and knowledge of previous history life cycles, no empire leader has ever been able to prevent its supremacy from collapsing. For instance, the successive Chinese dynasties would always rise, stay and fall regardless of lessons learned from the past. Empire life cycles would repeat over and over following a same cyclical pattern of around 248 years: 1776 + 248 = 2024 (see also HERE).
Subscribe to:
Posts (Atom)