Showing posts with label Algorithmic Pricing. Show all posts

Saturday, October 7, 2023

The Three-Day Rolling Pivot Level | Mark B. Fisher


Mark Fisher is no ordinary trader. The ACD trading system (an opening range breakout concept) he described in his 2002 book The Logical Trader is the one he and his 75-plus traders at MBF Clearing Corp. still use to make a living on the New York markets day in and day out. Does it work? Ask anyone at Fisher's firm, and they'll tell you it does. Unlike many in the business of helping traders, Fisher is happy to share his system because he believes the more people there are using it, the more effective it will be. However, the following is not specifically about Fisher's ACD system, but about his Three-Day Rolling Pivot concept (from the same book) and the general function of balance levels in daily and weekly market maker templates, about the market maker algorithm, and the origins and basic rationale of short-term trading. The 'rolling pivot' is an extension of Fisher's pivot range concept. 
 
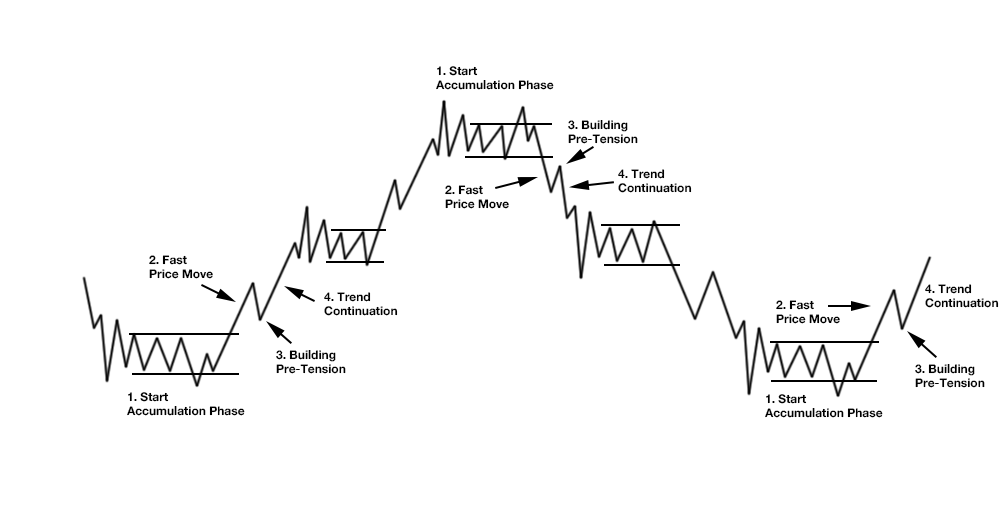
In the charts above a Six-Day Moving Average defines a mathematically exact balance level for all segments of the weekly and daily market maker cycles. The same is true for the balance levels defined by Fisher's Three Day Rolling Pivot, by the Weekly Pivot and by the Daily Pivot. All four govern market structure and price action within and between the trading days inside the weekly cycle. Balance levels, market structure and price action reflect the market maker logic and the process of auctioning the order flow. These balance levels can be utilized in many ways, such as to determine entry points, stops and trailing stops. Is the current price out of balance, what is the distance towards these balance levels? Price is always being moved between 'liquidity pools' and (re-) balance levels. Across hours, sessions, days and weeks the market maker orchestrates the exact same eternal recurrence of the accumulation-expansion-distribution-retracement-cycle between round numbers or levels (e.g. 0, 25, 50, 75; 0, 10, 20, 30 or 0, 20, 40, 50) also known as the pump & dump cycle.
 
3 Bar Patterns - the smallest fractals of market structure. Inside bars are ignored, the last bar of a fractal becomes
 the first of the next. Where are the round number levels, the breakout levels, liquidity, the balance levels?

Identify in the above charts day-trading, short-term trading and swing trading setups. Define price targets, entry-, exit-, stop-levels, profit/loss ratios. Be sure everything is logically solid and proportionally related to daily and weekly highs and lows and the balance levels.
 
» All my life I've been a 60/40 player, content to clear my 20%. «   -  Jesse Livermore

Programming the Livermore Market Key

Richard D. Wyckoff's Composite Operator a.k.a. Market Maker a.k.a Broker manages the order flow of 'buyers' and 'sellers' with a price generating auction algorithm realizing the highest mathematically possible return in 'dealing' with the flow of orders. Later on in life Wyckoff became a broker and market maker himself. His schematics and Jesse Livermore's tables illustrate the complete logic and algebra of the market maker's auction process and the pump & dump cycle. The auction algorithm works ever since it was invented. Livermore was able to do the math without calculator, paper and charts. Aged fourteen he started as a quotation board boy at a Boston brokerage business and literally saw patterns in the waves of numbers flowing each day from the ticker tape. Livermore came to understand that scheme generates more profit than any other business activity ever known to man. Fifteen year old Wyckoff had also begun as a broker’s runner to soon experience the exact same epiphany. Market makers were tremendously successful in multiplying their returns with the invention of electronic exchanges and with the invention of the daily global scheme between the 'Asian Session', the 'London Session', and the 'New York Session'. Wyckoff, Livermore and W.D. Gann were contemporaries, trading the same commodities, stocks and indices in the same exchanges. All were initiated into the auction algorithm. Wyckoff and Livermore were larger-than-life traders while Gann's true returns have always been subject of debates. He sold many expensive courses and forecasts. And what he sold to subscribers and students and how he actually traded for a living were very different things: Gann traded a double-tops-and-double-lows-in-the-direction-of-the-daily-trend-strategy - plain and simple pump & dump trading Wyckoff-Livermore style. What should we learn from all this? Maybe the lesson is to keep things as simple as possible as Tom Hougaard suggested.
 
Market maker pump & dump levels.

The accumulated length of the intraday price swings in the 1-minute chart of any instrument exceeds the daily true range several dozen times every single day. Imagine the factor on sub-1 minute time frames without having to deal with slippage nor transaction costs. Let that sink in. How is that possible? Understand the opening range concept and the logic and purpose of 'breakouts' and 'false breakouts' from that range. Monday's high and low define the opening range for the week; the high and low during the first thirty minutes the opening range of a session; the first three trading days of a new quarter limit the quarterly opening range; and the range of the first trading week of the year becomes the yearly opening range. Know the logic, principles and precision of price action and of market structure as taught nowadays e.g. by ICT or Stacey Burke: Price moving in one direction always creates the exact same imbalance on the opposite side. Imbalances are re-balanced by retracements of at least 50%. Price expands in proportions of 1/8ths or 1:1, 2:1, 3:1 etc. Price is always timed and measured and moves across all times frames always proportionately to the above listed opening ranges towards (re-) balance levels. Three and nine minutes are fractals within the hour; three hours a fractal within a session and the trading day; three and nine trading days are fractals within and across weeks; three and nine weeks fractals within months and quarters. Ideally Wednesdays and Fridays are timed for ending and re-starting three day fractals within the weekly market maker template.   
 
Calculation of the Three-Day Rolling Pivot:

Three-Day Rolling Pivot Price = (three-day high + three-day low + close) / 3
Second number = (three-day high + three-day low) / 2
Pivot differential = daily pivot price – second number
Three-Day Rolling Pivot Range High = daily pivot price + pivot differential [omitted in above charts]
Three-Day Rolling Pivot Range Low = daily pivot price – pivot differential
[omitted in above charts]

The Probabilistic Mindset of Successful Traders - Mark Douglas

Reference
:
Mark B. Fisher (2002) - The Logical Trader: Applying a Method to the Madness.

 
Mark B. Fisher

Friday, March 17, 2023

How Livermore Judges the Turning Points | Richard D. Wyckoff

Judging the main turning points in the long swings is the most important thing that he does, and if he could accomplish nothing else in between the panics and booms and accurately judge the right time for changing his position, he knows that he has a starting point for the rolling up of tremendous profits during the intervening year or two while the market is on its way from nadir to zenith. It is perfectly clear why this is so. A man who loads up at the low point of a panic has a certain amount of working capital. If he succeeds in selling out near the top of the boom, he has not only his original capital but his aggregate profits as well. If he then takes a short position with the line increased by reason of these profits and successfully rides this short line down to the next panic, he will find his resources vastly increased.
 
Quotation Board Girls copying the latest numbers calculated by the
Composite Man to the quotation board
in Waldorf Astoria's lobby to be acknowledged by the crowd as
the price and nothing but the price; New York, 1918.
 
These lines of stocks which Livermore takes on at the low points are not of course, always sold at the topmost prices. As the market executes its series of intermediate swings and begins to approach the level when an important turning point is likely to occur, he looks for more frequent reactions, and, therefore, will very often liquidate all or part of his line on some of the strong bulges which occur in the upper stages of the market, or in what is known as the selling zone. He does not consider it good policy to try and get the last point, for many things can happen which might bring the ultimate turning point nearer than he anticipated. 
 
He knows that all stocks do not make their tops simultaneously. Some reach their apex months before the last of them have exhausted their lifting power. The bull forces may be likened to an army which is carrying the defenses of the enemy: it can advance just so far without becoming exhausted and falling back. He knows that the principal bull ammunition is money and that general conditions govern and limit the extent of any move; also that it is not so much the news, the statistics, the dividends, etc. that are important but what is of dominating importance is the effect of the developments on the minds of men and the extent to which traders and investors are thereby induced to buy or sell. The market is not affected by what a million people think about the market, but it is immediately affected by their actual buying and selling or their failure to do either. 
 
 
While the long swings are of the utmost importance to him, they do not by any means constitute all of his operations. He is an active trader, for long ago he cured himself of jumping in and out of the market day after day.  
 
Next in importance to the trades which he makes are the intermediate swings running from ten to thirty points and from a week or two to a few months in duration. Let us say that the market is getting into the upper levels and although not at the turning point becomes overbought and the technical position is such that a reaction of ten to fifteen points is imminent. He decides that under such conditions it is best for him to reduce his line of long stocks in order that he may take advantage of whatever decline occurs by replacing them at lower prices. He may have twenty or thirty points profit in a certain lot of stock which he believes will sell at a higher figure eventually, but if he can close this out on the verge of a sharp reaction and replace it ten points cheaper, he has thereby reduced the original cost by that much. His judgment of the time and the direction of these intermediate swings can only be formed accurately by the action of the market as recorded on the tape of the ticker. He cannot gauge it properly in any other way. Where else can he see the gradual alteration from strength to weakness in the market; the complete supply of the absorption power; the ultimate weakening of support and the numerous other characteristics of such an episode.

Wyckoff started as a stockbroker's runner at the age of 15,
became a brokerage firm auditor a few years later,
and at age 25 opened his own brokerage firm.

Just as the market displays to his practiced eye the downward phase, so it forecasts the end of the reaction and the time to resume the long side. These indications appear in the leading stocks of important groups and in many individual issues - usually the most popular trading mediums. The principles of judging the market by its own action, Livermore learned long ago and he found that they operate over the whole wide range of stock market movements, from the little half-hourly ripples back and forth to the great swings in prices running from one to three years. It is a question of supply and demand and once recognized and properly applied, it goes a long way toward solving of most stock market problems.


The market moves along the line of least resistance and when demand is greater than supply this line is upward. To detect the momentary changes as well as those taking a longer time to work out, is the daily task of Mr. Livermore, just as it is the business of every manufacturer and merchant to judge the future course of his particular industry.

 
See also:
Richard D. Wyckoff (1910) - Studies in Tape Reading.
Richard D. Wyckoff (1922) - Exposing and Killing the Bucket Shops. 
Edwin Lefèvre (1923) - Jesse Livermore - Reminiscences of a Stock Operator.
Edwin Lefèvre (1925) - The Making of a Stockbroker. 
Richard D. Wyckoff (1930) - Wall Street Ventures & Adventures through Forty Years.
 Richard D. Wyckoff (1931) - The Wyckoff Method of Trading in Stocks. 

Monday, February 13, 2023

The Arithmetic of Pump & Dump Patterns | Jesse Livermore


Jesse Livermore was born in 1877 in Shrewsbury, Massachusetts, to a poverty-stricken farmer family. He learned to read and write at the age of three-and-a-half. At the age of 14 his father pulled him out of school to help with the farm. However, with his mother's blessing, Livermore ran away from home to begin to live on his own behalf and responsibility aged 14 as a quotation board boy at a Boston stock brokerage business earning $5 per week. By 1923 Livermore was one of the richest people in the world. He was, he believed, particularly suited to his first job because of his strong abilities in mental arithmetic and number memorization.
 
The 1870 census in the US found that 1 out of every 8 children below 14 years old
was a wage slave. By 1910 it was 1 out of 5.
 
Stock and commodity prices came into his broker’s office on a ticker tape, a continuous strip of paper. It was Livermore’s job to read, to memorize and to transfer all the price numbers as they come in to the quotation board outside for all the broker’s different clientele crowds in and around the trading pits and lobbies to be seen and to animate them to act in that very specific foolish way they were expected to act: buying and selling and placing buy-, sell- and stop orders at certain levels. This is exactly what generates these constantly repeating tremendous opportunities, profits and cuts for the broker and for the invisible Composite Operator over there in New York and in Chicago. He realized that for the rest of his life his destiny became aligned to this information of the ticker tape and his ability to understand the message of the algorithm. Livermore literally saw patterns in the waves of numbers that flowed each day from the tape and aligned his activity accordingly. He began to write those numbers in his own notebook and tested himself, predicting the direction that different stock prices would take at certain levels, times and days. 
 
Patterns in the Waves of Numbers:
Arithmetic of the Pump and Dump.
 
Price delivered by Composite Man for the broker through the broker to the broker's different clientele crowds. Livermore realized that scheme generates more profit than any other business activity ever known to man. For the Composite Operator. Hence he aligned himself to the tune of the invisible Composite Operator's price algorithm coming in on the ticker tape from New York and Chicago. The cumulative price range of all one minute price bars of any instrument traded by any broker on any given day nowadays exceeds what is called The Average Daily Price Range by the factor of fifty. Fifty times the so called average daily trading range during each and every single trading day. Up and down. Every day. Say the average daily price range of a given instrument is 1,000, the cumulative price will range around 50,000 during any trading day. Up and down. From balance to imbalance back and forth in this very specific manner and sequence through time and price.
 
He used breakouts to a high degree of success. He would wait for price to break above a certain pivot level and then go long to ride on the emerging trend. Daily and weekly highs and lows, session highs and lows, measured moves and Floor Trader's Daily and Weekly Pivot Point Levels provide all clues for Livermore's pivotal levels. He would exit a trade only when a similar breakout occurs in the opposite direction, signifying a potential reversal in trend after a peak formation high or low, that is a change of structure and direction of price. If the reversal signal is strong enough, he would take a short trade and ride the bear market.
 
"Many years of my life had been devoted to speculation before it dawned upon me that nothing new was happening in the stock market, that price movements were simply being repeated, that while there was variation in different stocks the general price pattern was the same." Livermore used to say: "Whatever happens in the stock market today has happened before and will happen again". 
 
In his notebook Livermore fills prices into columns headed Secondary Rally  -  Natural Rally Up Trend  - Down Trend  -  Natural Reaction, and Secondary Reaction.
 
Trend Change Rules

Livermore’s approach to swing trading required two filters: (1.) a larger swing filter and (2.) a penetration filter of one-half the size of the swing filter. Penetrations were significant at price levels he called pivot points. A pivot point is defined in retrospect as the top and bottom of each new swing. The pivot points in the below swing chart are marked with letters. Positions are taken only in the direction of the major trend. A major uptrend is defined by confirming higher highs and higher lows, and a major downtrend by lower lows and lower highs, and where the penetration filter (swing filter) is not broken in the reverse direction. That is, an uptrend is still intact as long as prices do not decline below the previous pivot point by as much as the amount of the penetration filter. Once the trend is identified, positions are added each time a new penetration occurs, confirming the trend's direction. A stop-loss is placed at the point of penetration beyond the prior pivot point. Unfortunately Livermore never revealed how the penetration point was calculated. It seems however to be a percentage of the current swing size (e.g. 16%, 20%, 25%, 33%,50%)
 
Failed Reversal in the Livermore Method

In Livermore's system the first penetration of the stop-loss (a swing high or low depending on the direction of the trade) calls for liquidation of the current position. A second penetration is the necessary confirmation for the new trend. If the second penetration fails (at point K) it is considered a secondary reaction within the old trend. The downtrend may be re-entered at a distance of the swing filter below K, guaranteeing that point K is defined, and again on the next swing, following pivot point M when prices reach the penetration level below pivot point L. It is easier to re-enter an old trend than to establish a position in a new one.
 
This is Jesse Livormore's insight and conclusion:
  1. Markets are never wrong opinions often are. Back your judgment and don't trust your opinion, until the action of the market itself confirms your opinion.
  2. Few people ever make money on tips, beware of inside information. If there was easy money lying around, no one would be forcing it into your pocket.
  3. Money is made by sitting, not trading. It takes time to make money. Don't give me timing; give me time.
  4. Buy right, sit tight. Big movements take time to develop. Men who can both be right and sit tight are uncommon.
  5. Money cannot consistently be made by trading every day or every week during the year.
  6. Nothing new ever occurs in the business of speculating or investing in securities and commodities.
  7. Never average losses.
  8. The human side of every person is the greatest enemy of the average investor or speculator. Wishful thinking must be banished.
 

References:
Richard D. Wyckoff (1920) - Jesse Livermore's Methods of Trading in Stocks.
Edwin Lefèvre (1923) - Reminiscences of a Stock Operator.
Jesse Livermore (1940) - How To Trade In Stocks.
Jesse Thompson (1983) - The Livermore System. In: Technical Analysis of Stocks & Commodities. 
Mark B. Fisher (2002) - The Logical Trader.
 Richard Smitten (2005) - Trade Like Jesse Livermore.

The Closing Auction | Price Discovery, Liquidity, and Disagreement


The closing auction accounts for a striking 7.5% of daily volume in 2018, up from 3.1% in 2010. The growth of indexing and ETFs shifts trading towards the close and distorts closing prices: they often deviate from closing quote midpoints, but the deviations revert by half shortly after the close and fully overnight. As volume migrates towards the close, liquidity at the open deteriorates.

Quoted from:
Vincent Bogousslavsky & Dmitriy Muravyev (Dec 3, 2020) - Who Trades at the Close?
Implications for Price Discovery, Liquidity, and Disagreement.

See also:
TPR (Jan 12, 2023) - The ICT Power of 3: Accumulation - Manipulation - Distribution (AMD).

Wednesday, December 21, 2022

Accumulation & Distribution Schematics | Richard D. Wyckoff


An understanding of manipulative procedure in any-event helps us to judge the motives, the hopes, fears and, aspirations of all the buyers and sellers whose actions today have the same net effect upon the market as 30 many pool operations would have. So if we are squeamish about the term "manipulator" we may substitute the words "Composite Operator" with the same force and affect. Some people might object to this statement on the ground that regulation of the stock market has eliminated pool operations. Even though pool operations and old-fashioned manipulation are banned by law, for our purpose in studying, understanding and correctly interpreting market action, we must consider any operation a "manufactured" movement wherein the buying or the selling is sufficiently concerted and coming from interests better informed than the public as to produce the same effects as pure manipulation. 

[...] The market is made by the minds of men, and all the fluctuations in the market and in all the various stocks should be studied as if they were the result of one man’s operations. Let us call him the Composite Man, who, in theory, sits behind the scenes and manipulates the stocks to your disadvantage if you do not understand the game as he plays it; and to your great profit if you do understand it.

Great activity and breadth induces trading in large quantities by big operators on the floor and outside. Such a market enables the manipulator to unload a large line of stock. When he wishes to accumulate a line, he raids the market for that stock, makes it look very weak, and gives it the appearance of heavy liquidation by sending in selling orders through a great number of brokers.

You say all this is unethical, if not unscrupulous. You say it is a cruel and crooked game. Very well. Electricity can be very cruel, but you can take advantage of it; you can make it work for your benefit. Just so with the stock market and the Composite Man. Play the game as he plays it. I am giving you the inside view.


See also: