Upcoming SoLunar Turn-Days are: Mar 05 (Sun), Mar 09 (Thu), Mar 12 (Sun), Mar 16 (Thu), Mar 20 (Mon), Mar 24 (Fri), Mar 27 (Mon), Mar 31 (Fri), Apr 03 (Mon). Previous SoLunar Maps HERE


 |
| SPX vs SoLunar Map | February 2017 | Review & Preview |

 |
| Upcoming SoLunar turn-days: Nov 14 (Mon), Nov 18 (Fri), Nov 21 (Mon), Nov 25 (Fri), Nov 29 (Tue), Dec 03 (Sat). |
 |
| Upcoming SoLunar turn-days: Oct 01 (Sat), Oct 05 (Wed), Oct 08 (Sat), Oct 12 (Wed), Oct 16 (Sun), Oct 19 (Wed), Oct 23 (Sun), Oct 27 (Thu), Oct 31 (Mon), Nov 03 (Thu), Nov 07 (Mon), Nov 10 (Thu), Nov 14 (Mon), Nov 18 (Fri), Nov 21 (Mon), Nov 25 (Fri), Nov 29 (Tue), Dec 03 (Sat). |
 |
| These
charts depict the solunar bias for short-term movements of stock
indices two months ahead. The markets are certainly influenced also by other planetary forces - especially longer-term - but a 3-5 day short-term rhythm and pattern is governed by the solunar forces (= 4 highs and 4 lows per lunar month). The solunar forces are a composite of Sun-Moon angles, orbital eccentricities, declinations and some long-term cycles. A Low in the SoLunar Map frequently is a High in the stock market and vice versa. Inversions occur, and if so, they should occur only once every 4 lunar months around a New Moon (max +/- 7 days). The solunar rhythm is frequently disturbed by (1.) the FED, and (2.) by sudden solar activity, altering the geomagnetic field, and hence the mass mood. This can result in the skip and/or inversion of pivots in the SoLunar Map. An increasing number of sunspots and flares have usually a negative influence on the stock market some 48 hours later, and vice versa (Ap values > 10 are usually short-term negative). A rising blue line in the SoLunar Map means the bias for the market is side-ways-to-up, and vice versa. Highs and lows in the SoLunar Map also may coincide with the start and termination of complex, side-ways correction patterns like zig-zags, triangles or flags. Previous SoLunar Maps HERE |
 |
| Upcoming SoLunar turn-days: Oct 01 (Sat), Oct 05 (Wed), Oct 08 (Sat), Oct 12 (Wed), Oct 16 (Sun), Oct 19 (Wed), Oct 23 (Sun), Oct 27 (Thu), Oct 31 (Mon). |
 |
| Upcoming soLunar turn-days: Aug 29 (Mon), Sep 01 (Thu), Sep 05 (Mon), Sep 09 (Fri), Sep 13 (Tue), Sep 17 (Sat), Sep 20 (Tue), Sep 23 (Fri), Sep 27 (Tue), Oct 01 (Sat), Oct 05 (Wed). Previous SoLunar Maps HERE |
 |
| Upcoming turn-days are: Aug 18 (Thu), Aug 21 (Sun), Aug 25 (Thu), Aug 29 (Mon), Sep 01 (Thu). See also HERE |
 |
| Upcoming turn-days are: Jul 30 (Sat), Aug 03 (Wed), Aug 07 (Sun), Aug 11 (Thu), Aug 14 (Sun), Aug 18 (Thu), Aug 21 (Sun), Aug 25 (Thu), Aug 29 (Mon), Sep 01 (Thu), Sep 05 (Mon), Sep 09 (Fri), Sep 13 (Tue), Sep 17 (Sat), Sep 20 (Tue), Sep 23 (Fri), Sep 27 (Tue), Oct 01 (Sat). Previous SoLunar Maps HERE |
 |
| These charts depict the solunar bias for short-term movements of stock indices two months ahead. The markets are certainly influenced also by other planetary forces - especially longer-term - but a 3-5 day short-term rhythm and pattern is governed by the solunar forces (= 4 highs and 4 lows per lunar month). The solunar forces are a composite of Sun-Moon angles, orbital eccentricities, declinations and some long-term cycles. A Low in the SoLunar Map frequently is a High in the stock market and vice versa. Inversions occur, and if so, they should occur only once every 4 lunar months around a New Moon (max +/- 7 days). The solunar rhythm is frequently disturbed by (1.) the FED, and (2.) by sudden solar activity, altering the geomagnetic field, and hence the mass mood. This can result in the skip and/or inversion of pivots in the SoLunar Map. An increasing number of sunspots and flares have usually a negative influence on the stock market some 48 hours later, and vice versa (Ap values > 10 are usually short-term negative). A rising blue line in the SoLunar Map means the bias for the market is side-ways-to-up, and vice versa. Highs and lows in the SoLunar Map also may coincide with the start and termination of complex, side-ways correction patterns like zig-zags, triangles or flags. |

 |
| “It is very true, some of the Ancients have Winter and Summer, made the day and night to consist of equal hours. I mean every hour to consist of sixty minutes, equally; but Astrologists do not so, but follow this method, viz. according to the motion of the Sun both Summer and Winter, so do they vary their hours in length or shortness.” One measures the time between sunrise and sunset and divides it into 12 equal parts. These are the planetary hours (HERE) |
 |
| June 18 (Sat) was a minor turn day in the geocentric and the heliocentric Bradley Indices, June 20 (Mon) was a rare Summer Solstice Full Moon, the stock market seems in line with the SolunarMap, and should move sideways-to-down into Brexit-Thursday, June 23. |
 |
| Calculated and charted with Timing Solution. |
 |
| Enlarge |
 |
| Upcoming turn-days are: May 28 (Sat), Jun 01 (Wed), Jun 05 (Sun), Jun 09 (Thu), Jun 12 (Sun), Jun 16 (Thu), Jun 20 (Mon), Jun 23 (Thu), Jun 27 (Mon), Jun 30 (Thu), Jul 04 (Mon), Jul 08 (Fri), Jul 12 (Tue), Jul 15 (Fri), Jul 19 (Tue), Jul 23 (Sat), Jul 27 (Wed), Jul 30 (Sat), Aug 03 (Wed). Previous SoLunar Maps HERE |


 |
| The Solunar Map considers, weighs and combines Sun-Moon angles, orbital eccentricity and speed, declination and some longer-term lunar cycles. |
 |
| This
chart depicts the solunar bias for short-term movements of stock
indices two months ahead. The markets are certainly influenced also by other planetary forces - especially longer-term - but a 3-5 day short-term rhythm and pattern is governed by the solunar forces (= 4 highs and 4 lows per lunar month). The solunar forces are a composite of Sun-Moon angles, orbital eccentricities, declinations and some long-term cycles. A Low in the SoLunar Map frequently is a High in the stock market and vice versa. Inversions occur, and if so, they should occur only once every 4 lunar months around a New Moon (max +/- 7 days). The solunar rhythm is frequently disturbed by (1.) the FED, and (2.) by sudden solar activity, altering the geomagnetic field, and hence the mass mood. This can result in the skip and/or inversion of pivots in the SoLunar Map. An increasing number of sunspots and flares have usually a negative influence on the stock market some 48 hours later, and vice versa (Ap values > 10 are usually short-term negative). A rising blue line in the SoLunar Map means the bias for the market is side-ways-to-up, and vice versa. Highs and lows in the SoLunar Map also may coincide with the start and termination of complex, side-ways correction patterns like zig-zags, triangles or flags. Upcoming turn-days are: Mar 30 (Wed), Apr 03 (Sun), Apr 07 (Thu), Apr 10 (Sun), Apr 14 (Thu), Apr 18 (Mon), Apr 22 (Fri), Apr 25 (Mon), Apr 29 (Fri), May 03 (Tue), May 07 (Sat), May 10 (Tue), May 14 (Sat), May 17 (Tue), May 21 (Sat), May 25 (Wed), May 28 (Sat), Jun 01 (Wed). Cross check these dates with the Cosmic Cluster Days, the Bradley Indices, and Jack Gillen's Sensitive Degrees. Previous SoLunar Maps HERE |
 |
| The inverted rotation. |

 |
| Seasonal Cycle Mar 01 - Mar 31 (1900-2015) = +0.82% 6th Year of the Decennial Cycle (2016) Mar 01 - Mar 31 = +1.96% 4th Year of the Presidential Cycle (2016) Mar 01 - Mar 31 = +1.95% SoLunar Map: Feb 26 (Fri), Mar 01 (Tue), Mar 05 (Sat), Mar 08 (Tue), Mar 12 (Sat), Mar 16 (Wed), Mar 19 (Sat), Mar 23 (Wed), Mar 27 (Sun), Mar 30 (Wed) |
 |
| Seasonal Cycle Jan 01 - May 31 (1900-2015) = +2.82% 6th Year of the Decennial Cycle (2016) Jan 01 - May 31 = +3.49% 4th Year of the Presidential Cycle (2016) Jan 01 - May 31 = -0.97% |
 |
| Seasonal Cycle (1900-2015) Jan 01 - Dec 31 = +6.99% 4th Year of the Presidential Cycle (2016) Jan 01 - Dec 31 = +6.52% 6th Year of the Decennial Cycle (2016) Jan 01 - Dec 31 = +6.98% |
 |
| 4th Year of the Presidential Cycle (2016) Jan 01 - Dec 31 = +6.52% 6th Year of the Decennial Cycle (2016) Jan 01 - Dec 31 = +6.98% 1st Year of the Presidential Cycle (2017) Jan 01 - Dec 31 = +5.48% 7th Year of the Decennial Cycle (2017) Jan 01 - Dec 31 = +4.82% 2nd Year of the Presidential Cycle (2018) Jan 01 - Dec 31 = +2.99% 8th Year of the Decennial Cycle (2018) Jan 01 - Dec 31 = +13.13% 3rd Year of the Presidential Cycle (2019) Jan 01 - Dec 31 = +10.12% 9th Year of the Decennial Cycle (2019) Jan 01 - Dec 31 = +10.62% |
 |
| This
chart depicts the solunar bias for short-term movements of stock
indices two months ahead. The markets are certainly influenced also by other planetary forces - especially longer-term - but a 3-5 day short-term rhythm and pattern is governed by the solunar forces (= 4 highs and 4 lows per lunar month). The solunar forces are a composite of Sun-Moon angles, orbital eccentricities, declinations and some long-term cycles. A Low in the SoLunar Map frequently is a High in the stock market and vice versa. Inversions occur, and if so, they should occur only once every 4 lunar months around a New Moon (max +/- 7 days). The solunar rhythm is frequently disturbed by (1.) the FED, and (2.) by sudden solar activity, altering the geomagnetic field, and hence the mass mood. This can result in the skip and/or inversion of pivots in the SoLunar Map. An increasing number of sunspots and flares have usually a negative influence on the stock market some 48 hours later, and vice versa (Ap values > 10 are usually short-term negative). A rising blue line in the SoLunar Map means the bias for the market is side-ways-to-up, and vice versa. Highs and lows in the SoLunar Map also may coincide with the start and termination of complex, side-ways correction patterns like zig-zags, triangles or flags. Upcoming turn-days are: Jan 28 (Thu), Feb 01 (Mon), Feb 04 (Thu), Feb 08 (Mon), Feb 11 (Thu), Feb 15 (Mon), Feb 26 (Fri), Mar 01 (Tue), Mar 05 (Sat), Mar 08 (Tue), Mar 12 (Sat), Mar 16 (Wed), Mar 19 (Sat), Mar 23 (Wed), Mar 27 (Sun), Mar 30 (Wed), Apr 03 (Sun). Cross check these dates with the Cosmic Cluster Days, the Bradley Indices, and Jack Gillen's Sensitive Degrees. Previous SoLunar Maps HERE |
 |
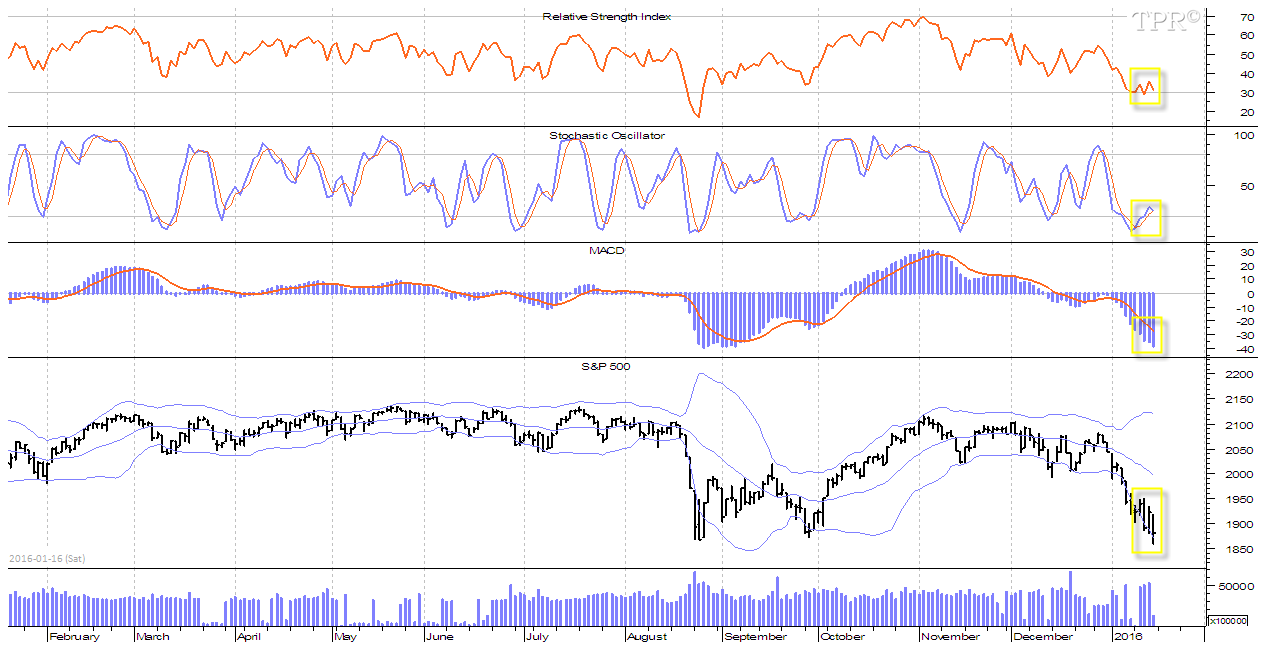
| Please note: since around Jan 13th the correlation flipped = now Low in the SoLunar Map is Low in the SPX; a High in the etc. |