Showing posts sorted by relevance for query Wyckoff. Sort by date Show all posts

Friday, August 30, 2024

Re-Accumulation and Re-Distribution Range Patterns | Richard D. Wyckoff

The Re-Accumulation process is exactly identical to the Accumulation process. The only difference between the two is the way the structure begins to develop. While the Accumulation range begins by stopping a bearish movement, the Re-Accumulation range begins after the stop of an 
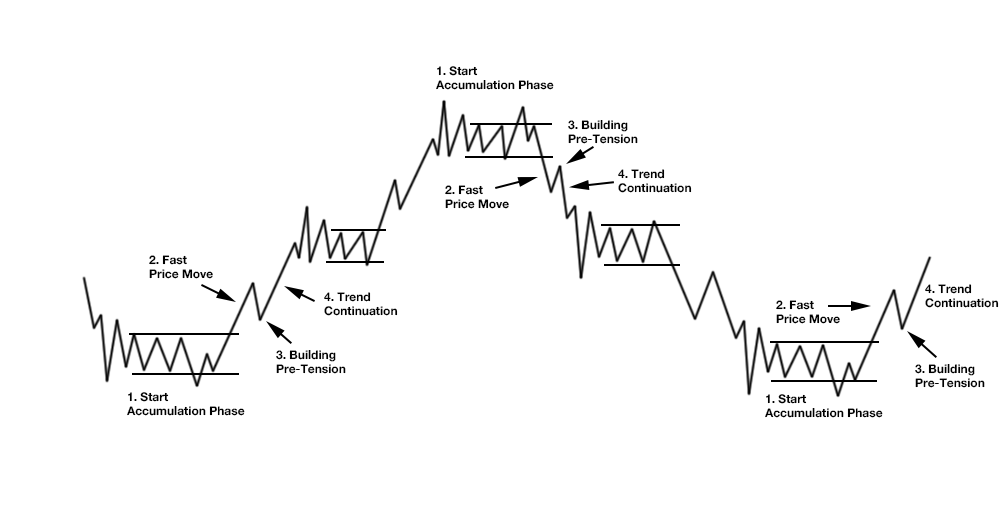
upward movement. Re-accumulation and re-distribution generally unfold in four distinct continuation range patterns.
 
S&P 500 E-mini Futures (4 hour bars - August 15-30, 2024) — Distribution or Re-Accumulation?
 
 
 The Eternal Recurrence of the Same.
 
(1.) Accumulation, (2.) Mark Up, (3.) Distribution, (4.) Mark Down.

To put it another way: A Re-Accumulation occurs during a longer-term up trend, which will continue in the future. The main street is finally on the right side as well. Inside a Wyckoff Re-Accumulation schematic, buyers are closing parts of their long positions and sellers are joining the market. With the incoming selling positions, market makers can fill new long positions again.

 4 Types of Re-Accumulation Ranges a.k.a. Continuation Patterns a.k.a. Trend Continuation:
(1.) Re-Accumulation after a Decline.
(2.) Re-Accumulation with Spring Action.
(3.) Re-Accumulation after a Shakeout.
(4.) Re-Accumulation with an Uprising Structure.

The 4 Re-Distribution types are simply the opposite (lower 4 schematics):
(1.) Re-Distribution after a Rally.
(2.) Re-Distribution with Spring Action.
(3.) Re-Distribution after a Shakeout.
(4.) Re-Distribution with a Declining Structure.

 Examples of different types of Re-Accumulation Patterns in the Apple (AAPL) Weekly Chart.
 
The events and phases are still the same (see the Accumulation and Distributions Schematics - the last 4 charts). Only the beginning of the Re-Accumulation cycle is different and equals the start of a distribution cycle. Take a look at the Wyckoff distribution schematics below for the occurring events. The main events that differ from an accumulation or distribution cycle are the occurrences of the Creek. The Creek is a small trend over time and can equal a smaller consolidation. The Creek builds liquidity on both sides of the market and misleads market participants. The Jump Across the Creek (JAC) is the event that causes the SoS. The Jump Across the Creek does take out previous resistance lines with a strong up move. The Jump Across the Creek can also occur inside the trading range of the accumulation. The Creek can be the horizontal resistance defined by Phases A and B or an internal trend line that formed inside Phase B.
  • After the spring and test events, there is a bullish price move with momentum. This is called the Jump Across the Creek. Price continues with a bullish Phase E.
  • Usually, any shakeout and/or decline action before Re-Accumulation will have a local smaller distribution pattern (cause and effect).
  • The Initial Shakeout/Decline is less pronounced during Re-Accumulation than before Accumulation.
  • Volume: Re-Accumulation usually has less supply than Accumulation.
  • The maximum swing of trading range (highest to lowest point): Re-Accumulation trading range is usually tighter compared with an Accumulation trading range.
 (1.) Re-Accumulation after a Decline
 
  • Weakest among the Re-Accumulation types.
  • Decline usually starts from a small local distribution pattern.
  • It can have different variations of the trading range (see the structure of the next 3 formations).
(2.) Re-Accumulation with Spring Action
 
  • Flat or sloping down formation.
  • It can potentially have a few lower lows with a spring being the lowest point of the trading range.
  • Leading stocks can exhibit short-term weakness after strength in this formation.
(3.) Re-Accumulation after a Shakeout
 
  • Absorption of supply happens in the trading range without violation of support.
  • Usually and depending on a position of the market, this pattern exhibits strength.
(4.) Re-Accumulation with an Uprising Structure 
 
  • Re-Accumulation with an Uprise is the strongest Re-Accumulation type.
  • This structure will exhibit higher highs / higher lows.
  • Sometimes can be confused with a topping trading range (Distribution).
 
 
 Accumulation Schematic #1: Phases A and B.

 Accumulation Schematic #1: Phases C, D and E.
 
 Distribution Schematic #3: Phases A, B, C, D and E = the Inversion of the  Accumulation Schematic #1
 
The Re-Distribution occurs inside a markdown cycle and stops a down-trend for a longer period. After bigger price moves even Main Street joins the trend. Now it is time for the market makers to bring the price into a consolidation phase to scare sellers and bring in new buyers. That ensures new liquidity for the institution’s to place new short orders. The start of a Wyckoff Re-Distribution schematic is the same as an Accumulation cycle. A Creek inside the trading range creates liquidity on both sides of the market, which gets taken by a UTAD. Many people will see this as a break-out to join bullish price action, but don’t get fooled. With a Jump across the Creek, the price is not only returning into the trading range but going to continue the downtrend from before.
 
 
  Distribution Schematic #2: Phases A and B.
 
 Distribution Schematic #2: Phases C, D and E.
 
Many believe that simply labeling the events is sufficient for detecting Wyckoff cycles. Don't forget that a supposed Distribution can become a Re-Accumulation or an Accumulation a Re-Distribution. Therefore, it is essential to presuppose a fundamental market analysis and confirm a Wyckoff cycle with COT data, Seasonality, or other longer-term confirmations. Don't make the mistake of looking for Accumulations and Distributions in lower time frames. It is easy to draw a supposed accumulation on a 5-minute chart, but a real Accumulation takes place in higher time frames. Since a Wyckoff cycle takes time to unfold, wait for the events to occur and be fully validated. Otherwise, one quickly get s distracted by the noise within the actual moves and makes bad trading decisions in the worst case. 


Wednesday, December 21, 2022

Accumulation and Distribution Schematics | Richard D. Wyckoff

The Wyckoff Method, developed by Richard Wyckoff in the early 1900s, explains how stock (or asset) prices move in cycles driven by big players like institutions or "smart money" (often called the "Composite Man" or market makers). These pros manipulate prices to buy low and sell high, profiting from retail investors (you and me, the "weak hands" who buy/sell based on emotions). 
 
Prices don't move randomly; they follow patterns in four main processes: Accumulation, Markup, Distribution, and Markdown. Within trends, there are pauses called Re-Accumulation (during uptrends) and Re-Distribution (during downtrends). Think of it like a chess game where smart money sets traps to take shares from scared or greedy small traders.
The Overall Market Cycle and Why It Works
Markets cycle: Downtrend → Accumulation → Markup → Distribution → Markdown → Repeat. Smart money (institutions with deep pockets) engineers this by controlling volume and price action. They use news, rumors, and patterns to manipulate psychology—fear at bottoms, greed at tops. Retail reacts emotionally, providing the liquidity (shares to buy/sell) that smart money needs. Tools like volume analysis help spot these phases: High volume on climaxes, low on tests.

To spot in charts: Look for ranges after trends, volume changes, and failed breakouts. Practice on historical charts to see how pros always win by being patient and contrarian.

1. Accumulation: Buying Cheap at the Bottom
This happens after a long price drop (downtrend), when the market hits rock bottom. Everyone's panicking, selling cheap. Smart money sees value and starts secretly buying without driving prices up too fast. 
 
 Accumulation Characteristics.
 
Step 1: Preliminary Support (PS): Prices fall hard, but selling slows as smart money begins quiet buying to stop the drop. Volume (trading amount) is high from panic sellers, but price stabilizes a bit. Market makers absorb shares from weak hands dumping in fear.
Step 2: Selling Climax (SC): A final massive sell-off hits the lowest point. Volume explodes as retail dumps everything. Smart money buys aggressively here, creating a "climax" where selling exhausts itself. Price bounces slightly.
Step 3: Automatic Rally (AR): After the climax, price rises automatically as short-sellers (betting on further drops) cover positions, and some buyers return. This rally is short-lived, testing if selling is over.
Step 4: Secondary Test (ST): Price falls back to re-test the low from the climax, but on lower volume—meaning less selling pressure. If it holds, it confirms smart money has control. They might "spring" the price below support briefly to scare out remaining weak hands and grab their shares cheap.
Step 5: Building the Range: Price moves sideways in a "trading range" (box between support and resistance lines). Smart money accumulates millions of shares discreetly over weeks/months. They use "shakes" (fake drops) to buy more. Volume dries up on down moves (no real selling) and picks up on up moves.
What Market Makers Do: Act like sponges, soaking up supply from fearful sellers without alerting the public. They avoid bidding wars by timing buys during weakness. Goal: Own a huge position at low cost before the uptrend starts.
Other Participants: Retail sells in despair ("capitulation"). Weak institutions might sell too. Smart money traps shorts by not letting prices crash further.
End Sign: "Last Point of Support" (LPS)—a final test where price holds firm on tiny volume. Then, a "Sign of Strength" (SOS): Price breaks above resistance on high volume, starting the uptrend.

Result: Smart money now controls supply, ready to pump prices.
 
2. Markup: The Uptrend Rise
Once accumulated, smart money drives prices up for profit.
  • Prices rise steadily or in waves. Volume increases on up days, decreases on pullbacks.
  • Smart money sells a bit during rises to retail chasing gains (FOMO—fear of missing out), but holds most for higher prices.
  • Pullbacks are shallow; smart money buys dips to keep momentum.
  • This phase can last months/years, with news often turning positive to attract buyers.
3. Distribution: Selling High at the Top
Mirror of accumulation, but at peaks after a long rise. Euphoria peaks; retail buys high. Smart money sells into this greed without crashing prices immediately.
 
 Distribution Characteristics.

Step 1: Preliminary Supply (PSY): Uptrend slows; first signs of heavy selling (supply) appear on high volume, but price doesn't drop much yet. Smart money starts offloading to eager buyers.
Step 2: Buying Climax (BC): Final frenzy—prices spike on huge volume as retail piles in. Smart money dumps massively here.
Step 3: Automatic Reaction (AR): Price falls automatically as buying exhausts. Tests if more demand exists.
Step 4: Secondary Test (ST): Price rallies back to re-test the high, but on lower volume—weak demand. Smart money might "upthrust" (fake breakout above resistance) to trap more buyers, then let it fall.
Step 5: Building the Range: Sideways range forms at the top. Smart money distributes shares to retail. Uses "upthrust after distribution" (UTAD) to fake strength, sucking in bulls before dropping.
What Market Makers Do: Flood the market with supply during hype, using rallies to sell without panic. They create illusions of strength (false breakouts) to offload at peak prices. Goal: Exit positions profitably before the crash.
Other Participants: Retail buys in greed, thinking the uptrend continues. Shorts get squeezed out. Weak hands get trapped holding overpriced assets.
End Sign: "Last Point of Supply" (LPSY)—final weak rally. Then, "Sign of Weakness" (SOW): Price breaks below support on high volume, starting the downtrend.

Result: Smart money cashes out; retail left holding the bag.

4. Markdown: The Downtrend Fall
Prices drop as supply overwhelms demand.
  • Falls in waves, with brief rallies (dead cat bounces) where smart money might short more.
  • Volume high on down days. News turns negative, scaring more sellers.
  • Leads back to accumulation bottom.
5. Re-Accumulation: Pausing During Uptrends
Mid-uptrend pause to "reload." After a rally, momentum fades; smart money consolidates to buy more or shake out weak bulls.
  • Shorter, tighter range than full accumulation.
  • Involves "backing up to the creek" (minor drop to support) or "jumping the creek" (break above resistance).
  • Smart money tests for remaining supply, absorbs it, then resumes markup.
  • Looks like a mini-accumulation: Support tests, low-volume pullbacks, then strong breakout.
  • What Happens: Prevents overheating; smart money builds more positions cheaply during dips, trapping shorts who think the uptrend ended.
6. Re-Distribution: Pausing During Downtrends
Mid-downtrend halt to "reload shorts." Fake recovery attracts buyers, allowing smart money to sell more or initiate shorts.
  • Shorter than full distribution.
  • Uses "upthrusts" or "jump across the creek" (false rallies) to trap longs.
  • Smart money creates liquidity by luring buyers, then dumps to resume markdown.
  • Looks like mini-distribution: False highs, high-volume failures, then breakdown.
  • What Happens: Builds false hope; smart money offloads remaining longs or adds shorts during the fake strength.
 

» An understanding of manipulative procedure in any-event helps us to judge the motives, the hopes, fears and, aspirations of all the buyers and sellers whose actions today have the same net effect upon the market as 30 many pool operations would have. So if we are squeamish about the term "manipulator" we may substitute the words "Composite Operator" with the same force and affect. 

Some people might object to this statement on the ground that regulation of the stock market has eliminated pool operations. Even though pool operations and old-fashioned manipulation are banned by law, for our purpose in studying, understanding and correctly interpreting market action, we must consider any operation a "manufactured" movement wherein the buying or the selling is sufficiently concerted and coming from interests better informed than the public as to produce the same effects as pure manipulation. 
[...] The market is made by the minds of men, and all the fluctuations in the market and in all the various stocks should be studied as if they were the result of one man’s operations. Let us call him the Composite Man, who, in theory, sits behind the scenes and manipulates the stocks to your disadvantage if you do not understand the game as he plays it; and to your great profit if you do understand it. 
Great activity and breadth induces trading in large quantities by big operators on the floor and outside. Such a market enables the manipulator to unload a large line of stock. When he wishes to accumulate a line, he raids the market for that stock, makes it look very weak, and gives it the appearance of heavy liquidation by sending in selling orders through a great number of brokers.
 
You say all this is unethical, if not unscrupulous. You say it is a cruel and crooked game. Very well. Electricity can be very cruel, but you can take advantage of it; you can make it work for your benefit. Just so with the stock market and the Composite Man. Play the game as he plays it. I am giving you the inside view. «
Richard D. Wyckoff
1931 
 
Richard Wyckoff's market cycle theory centers on accumulation and distribution phases driven by insiders. Accumulation occurs at market bottoms, where sophisticated players discreetly buy assets over months without spiking prices. It begins with preliminary support, stabilizing prices, followed by a selling climax where panic selling exhausts, allowing insiders to absorb shares. Secondary tests confirm this, forming a sideways range where insiders accumulate without attracting attention. Once filled, the markup phase starts as insiders push prices up, rumors spread, and retail investors buy aggressively, driving prices past value. 
» At the bottom of a market, if the price spikes up, you should see the volume rise. That indicates accumulation. In the distribution stage, as the price falls, the volume should rise, while during price spikes upward, the volume should decline. By analyzing price and volume, you can determine whether you are in an accumulation phase or a distribution phase. That’s in an ideal world. « 
» Insiders, highly sophisticated investors, accumulate assets discreetly, avoiding price spikes. Suddenly, the market surges as retail investors drive prices beyond intrinsic value. At this peak, distribution begins, with those same insiders covertly offloading their holdings.

Distribution follows at the top, where insiders offload positions surreptitiously into retail demand. This starts with preliminary supply, followed by a buying climax where insiders sell into FOMO-driven buying. A consolidation range forms, with upthrusts trapping late buyers before a markdown begins as prices collapse. Wyckoff’s framework, used in stocks, forex, and crypto, relies on volume and price action to spot these phases. I can analyze specific assets or charts for real-time signals if you provide details.
 « 

See also:
 

Friday, March 17, 2023

How Livermore Judges the Turning Points | Richard D. Wyckoff

Judging the main turning points in the long swings is the most important thing that he does, and if he could accomplish nothing else in between the panics and booms and accurately judge the right time for changing his position, he knows that he has a starting point for the rolling up of tremendous profits during the intervening year or two while the market is on its way from nadir to zenith. It is perfectly clear why this is so. A man who loads up at the low point of a panic has a certain amount of working capital. If he succeeds in selling out near the top of the boom, he has not only his original capital but his aggregate profits as well. If he then takes a short position with the line increased by reason of these profits and successfully rides this short line down to the next panic, he will find his resources vastly increased.
 
Quotation Board Girls copying the latest numbers calculated by the
Composite Man to the quotation board
in Waldorf Astoria's lobby to be acknowledged by the crowd as
the price and nothing but the price; New York, 1918.
 
These lines of stocks which Livermore takes on at the low points are not of course, always sold at the topmost prices. As the market executes its series of intermediate swings and begins to approach the level when an important turning point is likely to occur, he looks for more frequent reactions, and, therefore, will very often liquidate all or part of his line on some of the strong bulges which occur in the upper stages of the market, or in what is known as the selling zone. He does not consider it good policy to try and get the last point, for many things can happen which might bring the ultimate turning point nearer than he anticipated. 
 
He knows that all stocks do not make their tops simultaneously. Some reach their apex months before the last of them have exhausted their lifting power. The bull forces may be likened to an army which is carrying the defenses of the enemy: it can advance just so far without becoming exhausted and falling back. He knows that the principal bull ammunition is money and that general conditions govern and limit the extent of any move; also that it is not so much the news, the statistics, the dividends, etc. that are important but what is of dominating importance is the effect of the developments on the minds of men and the extent to which traders and investors are thereby induced to buy or sell. The market is not affected by what a million people think about the market, but it is immediately affected by their actual buying and selling or their failure to do either. 
 
 
While the long swings are of the utmost importance to him, they do not by any means constitute all of his operations. He is an active trader, for long ago he cured himself of jumping in and out of the market day after day.  
 
Next in importance to the trades which he makes are the intermediate swings running from ten to thirty points and from a week or two to a few months in duration. Let us say that the market is getting into the upper levels and although not at the turning point becomes overbought and the technical position is such that a reaction of ten to fifteen points is imminent. He decides that under such conditions it is best for him to reduce his line of long stocks in order that he may take advantage of whatever decline occurs by replacing them at lower prices. He may have twenty or thirty points profit in a certain lot of stock which he believes will sell at a higher figure eventually, but if he can close this out on the verge of a sharp reaction and replace it ten points cheaper, he has thereby reduced the original cost by that much. His judgment of the time and the direction of these intermediate swings can only be formed accurately by the action of the market as recorded on the tape of the ticker. He cannot gauge it properly in any other way. Where else can he see the gradual alteration from strength to weakness in the market; the complete supply of the absorption power; the ultimate weakening of support and the numerous other characteristics of such an episode.

Wyckoff started as a stockbroker's runner at the age of 15,
became a brokerage firm auditor a few years later,
and at age 25 opened his own brokerage firm.

Just as the market displays to his practiced eye the downward phase, so it forecasts the end of the reaction and the time to resume the long side. These indications appear in the leading stocks of important groups and in many individual issues - usually the most popular trading mediums. The principles of judging the market by its own action, Livermore learned long ago and he found that they operate over the whole wide range of stock market movements, from the little half-hourly ripples back and forth to the great swings in prices running from one to three years. It is a question of supply and demand and once recognized and properly applied, it goes a long way toward solving of most stock market problems.


The market moves along the line of least resistance and when demand is greater than supply this line is upward. To detect the momentary changes as well as those taking a longer time to work out, is the daily task of Mr. Livermore, just as it is the business of every manufacturer and merchant to judge the future course of his particular industry.

 
See also:
Richard D. Wyckoff (1910) - Studies in Tape Reading.
Richard D. Wyckoff (1922) - Exposing and Killing the Bucket Shops. 
Edwin Lefèvre (1923) - Jesse Livermore - Reminiscences of a Stock Operator.
Edwin Lefèvre (1925) - The Making of a Stockbroker. 
Richard D. Wyckoff (1930) - Wall Street Ventures & Adventures through Forty Years.
 Richard D. Wyckoff (1931) - The Wyckoff Method of Trading in Stocks. 

Saturday, October 7, 2023

The Three-Day Rolling Pivot Level | Mark B. Fisher


Mark Fisher is no ordinary trader. The ACD trading system (an opening range breakout concept) he described in his 2002 book The Logical Trader is the one he and his 75-plus traders at MBF Clearing Corp. still use to make a living on the New York markets day in and day out. Does it work? Ask anyone at Fisher's firm, and they'll tell you it does. Unlike many in the business of helping traders, Fisher is happy to share his system because he believes the more people there are using it, the more effective it will be. However, the following is not specifically about Fisher's ACD system, but about his Three-Day Rolling Pivot concept (from the same book) and the general function of balance levels in daily and weekly market maker templates, about the market maker algorithm, and the origins and basic rationale of short-term trading. The 'rolling pivot' is an extension of Fisher's pivot range concept. 
 
In the charts above a Six-Day Moving Average defines a mathematically exact balance level for all segments of the weekly and daily market maker cycles. The same is true for the balance levels defined by Fisher's Three Day Rolling Pivot, by the Weekly Pivot and by the Daily Pivot. All four govern market structure and price action within and between the trading days inside the weekly cycle. Balance levels, market structure and price action reflect the market maker logic and the process of auctioning the order flow. These balance levels can be utilized in many ways, such as to determine entry points, stops and trailing stops. Is the current price out of balance, what is the distance towards these balance levels? Price is always being moved between 'liquidity pools' and (re-) balance levels. Across hours, sessions, days and weeks the market maker orchestrates the exact same eternal recurrence of the accumulation-expansion-distribution-retracement-cycle between round numbers or levels (e.g. 0, 25, 50, 75; 0, 10, 20, 30 or 0, 20, 40, 50) also known as the pump & dump cycle.
 
3 Bar Patterns - the smallest fractals of market structure. Inside bars are ignored, the last bar of a fractal becomes
 the first of the next. Where are the round number levels, the breakout levels, liquidity, the balance levels?

Identify in the above charts day-trading, short-term trading and swing trading setups. Define price targets, entry-, exit-, stop-levels, profit/loss ratios. Be sure everything is logically solid and proportionally related to daily and weekly highs and lows and the balance levels.
 
» All my life I've been a 60/40 player, content to clear my 20%. «   -  Jesse Livermore

Programming the Livermore Market Key

Richard D. Wyckoff's Composite Operator a.k.a. Market Maker a.k.a Broker manages the order flow of 'buyers' and 'sellers' with a price generating auction algorithm realizing the highest mathematically possible return in 'dealing' with the flow of orders. Later on in life Wyckoff became a broker and market maker himself. His schematics and Jesse Livermore's tables illustrate the complete logic and algebra of the market maker's auction process and the pump & dump cycle. The auction algorithm works ever since it was invented. Livermore was able to do the math without calculator, paper and charts. Aged fourteen he started as a quotation board boy at a Boston brokerage business and literally saw patterns in the waves of numbers flowing each day from the ticker tape. Livermore came to understand that scheme generates more profit than any other business activity ever known to man. Fifteen year old Wyckoff had also begun as a broker’s runner to soon experience the exact same epiphany. Market makers were tremendously successful in multiplying their returns with the invention of electronic exchanges and with the invention of the daily global scheme between the 'Asian Session', the 'London Session', and the 'New York Session'. Wyckoff, Livermore and W.D. Gann were contemporaries, trading the same commodities, stocks and indices in the same exchanges. All were initiated into the auction algorithm. Wyckoff and Livermore were larger-than-life traders while Gann's true returns have always been subject of debates. He sold many expensive courses and forecasts. And what he sold to subscribers and students and how he actually traded for a living were very different things: Gann traded a double-tops-and-double-lows-in-the-direction-of-the-daily-trend-strategy - plain and simple pump & dump trading Wyckoff-Livermore style. What should we learn from all this? Maybe the lesson is to keep things as simple as possible as Tom Hougaard suggested.
 
Market maker pump & dump levels.

The accumulated length of the intraday price swings in the 1-minute chart of any instrument exceeds the daily true range several dozen times every single day. Imagine the factor on sub-1 minute time frames without having to deal with slippage nor transaction costs. Let that sink in. How is that possible? Understand the opening range concept and the logic and purpose of 'breakouts' and 'false breakouts' from that range. Monday's high and low define the opening range for the week; the high and low during the first thirty minutes the opening range of a session; the first three trading days of a new quarter limit the quarterly opening range; and the range of the first trading week of the year becomes the yearly opening range. Know the logic, principles and precision of price action and of market structure as taught nowadays e.g. by ICT or Stacey Burke: Price moving in one direction always creates the exact same imbalance on the opposite side. Imbalances are re-balanced by retracements of at least 50%. Price expands in proportions of 1/8ths or 1:1, 2:1, 3:1 etc. Price is always timed and measured and moves across all times frames always proportionately to the above listed opening ranges towards (re-) balance levels. Three and nine minutes are fractals within the hour; three hours a fractal within a session and the trading day; three and nine trading days are fractals within and across weeks; three and nine weeks fractals within months and quarters. Ideally Wednesdays and Fridays are timed for ending and re-starting three day fractals within the weekly market maker template.   
 
Calculation of the Three-Day Rolling Pivot:

Three-Day Rolling Pivot Price = (three-day high + three-day low + close) / 3
Second number = (three-day high + three-day low) / 2
Pivot differential = daily pivot price – second number
Three-Day Rolling Pivot Range High = daily pivot price + pivot differential [omitted in above charts]
Three-Day Rolling Pivot Range Low = daily pivot price – pivot differential
[omitted in above charts]

The Probabilistic Mindset of Successful Traders - Mark Douglas

Reference
:
Mark B. Fisher (2002) - The Logical Trader: Applying a Method to the Madness.

 
Mark B. Fisher