Showing posts with label AstroFin. Show all posts

Monday, October 10, 2022

Lunar Phases and Stock Returns | Kathy Yuan et al.

Kathy Yuan, Lu Zheng & Qiaoqiao Zhu (2002) - This paper investigates the relation between lunar phases and stock returns for a sample of 48 countries. We find strong global evidence that stock returns are lower on days around a full moon than on days around a new moon. Constructing a lunar trading strategy, we find that the magnitude of this return difference is roughly 4.2 percent per annum.  
 
 
Since lunar phases are likely to be related to investor mood and are not related to economic activities, our findings are thus not consistent with the predictions of traditional asset pricing theories that assume fully rational investors. The positive association we find between lunar phases and stock returns suggests that it might be valuable to go beyond a rational asset pricing framework to explore the psychological effects of investor behavior on stock returns. 

Figure 1 - Average Daily Return of the Global Portfolio by Lunar Dates

Figure 2 - Average Daily Stock Returns of Global Portfolio by Lunar Windows

Figure 3 - Distribution of Full Moon Days on Days of Week

Thursday, September 22, 2022

The Sun and the Moon | Jack Gillen

Jack Gillen (1979) - The Sun is an energy planet. It gives and takes energy. A solar cycle is 365.25 days. It affects the stock market every 30 days, as the Sun transits through the 12 signs of the zodiac. The Sun also has an 11-year solar cycle in which Sun-spot activity peaks, followed by five and a half years of solar flares, a period of more or less calm with respect to the Sun’s surface. And during this period the Sunspot areas emit a wide range of intense radio and electromagnetic radiation of various types, affecting people and conditions of the planet Earth. This has been researched not only by astrologers but by astronomers. It has a definite effect on the stock market, commodities, and other areas related to the stock market.


As in all living matters it seems to affect mundane things like corporations and the stock market in the same way. This is to say that with regard to the birth month and the birth date, six months prior to the birth date the solar cycle is high, giving energy and pushing the related company forward [Example 1]. The Sun also is a planet associated with the ego, appearance and personality. Six months prior to the birth date, the company is brought out before the public. The birth date to six months after, the energy flow is low it becomes weaker and this affects the stock market in the same way. 


As an example, the stock market was born May 17, 1792. So the months of May through November relate to low activity, affecting the market's price and structure. As we go from December through May, we go through the high cycle, the up period of the Sun. But there are many cycles of the Sun that affect different areas of the stock market as the Sun affects each house with relation to the buying public. In each six-month period of the year we will also find a close relationship between price. movement and volume from Aquarius to Leo, or from February to the last two weeks of July. Looking at example 1, we find that the birth month and the Sun cycle six months prior to the birth month is at a high level; six months after the birth date, it is at a low level.

In Example 2 we take the Midheaven aspect to the Ascendant. We can see in Example 2 that the chart of the stock exchange starts its up level in the sign of Aquarius and its down level begins in the sign of Leo. So these are the two breaking points within a year: under Aquarius and under Leo as the Sun transits these signs. The low part of the chart, which is the Nadir, is the sign of Libra. This will generally be the low point of the year, as October would always represent low price. low volume, in which the opposite point to the Midheaven is Aries. This would be affected by the planet represented at the Midheaven. However, in April, under no afflictions, this would be a great month where records would be set in the areas of volume and prices.

As we start with Aquarius, this would run from the last two weeks of January through the first two weeks of July. However, as the cycle proceeds through Pisces, which is a weak sign, it would represent a weak month for volume. From the latter part of March through April and May, and even into June, these could be above average months for prices and volume. Now, as the Leo portion is activated from July through October, these are very weak months. You cannot expect too much in the way of prices or volume. If there is any weakness in the market it will more or less have a breakdown during these months. Not only are we in the six-month period after the birth date but we also have the effect in the Leo portion of the house when the Sun is moving downward towards the Nadir, which is the cusp of the fourth house. The Midheaven is always the cusp of the tenth house. 

So the low points in this pattern would mainly be in February through Aquarius and in August when it drops down, with a peak at the Midheaven which would be in April under the sign of Aries.

The six-month cycle tends to extend from the Aquarius portion to the Leo portion and, again, from the Leo point to the February point prices tend to follow the volume curves from these aspects, with the weaknesses in the February-March, July-August and October-November periods. Therefore, in judging the stock market as to whether it will turn up or down, it is best to look at the Sun and the aspects pertaining to the Sun. If the Sun is under heavy affliction, these periods represent a bearish market. In good aspect, it will be bullish. In the good periods moving upward toward the Midheaven, it will be higher than normal. Moving toward the lower section, it will be lower than normal. This is why there will be so many depressions, recessions, panic and fear in the stock exchange in the latter part of the year as October approaches.

The Sun's aspect and influence on the market will also affect a lot of stocks because individual stocks are affected by the movement of the Dow-Jones Industrial. You have to relate a 50 percent mark-up on a bullish market and take away 50 percent of an individual stock if the market is bearish. You can only give a stock 25 percent on its own merit. This means if the market is bad and the stock shows an indication of moving up, the price ratio as far as at what price to sell should be at a 25 percent profit. There are other indications, though, at which you could go for a 50 percent profit if the earnings are extremely high. A lot of gold and silver stocks will generally do the opposite in a bad market, and go all the way up. But if the market is bad and the Sun cycle is moving into that low period, you want to go short, or short at 50 percent from its point at that degree at that time, when the market shows indications of falling backwards. The Sun is a minor influence in relation to the overall picture of the market; however, it affects the market every year and there will be a pattern to each period of the year as far as the Sun’s transit through that sign. This will also relate to individual stocks, which will show the same pattern. So do your homework. Any time you select a stock, find the month in which to buy it and the month in which to sell the month in which it is usually at its highest point. You can relate this to the Moon for its exact day for buying or selling.

The market is always influenced by the Sun pattern and it will happen year after year. From January to the last two weeks in July, market prices will trend upwards, and in the latter part of the year after the influence of Leo, the market will be down in price. This is the average trend that will always occur and it affects volume as well as prices. However, it is important to realize the influence of the Sun in the chart of the New York Stock Exchange, and the Sun’s complete cycle.

Also, any corporation will be affected by certain cycles of the Sun through these signs. It is important to backtrack about 12 years during the pattern of the Sun’s cycle in order to see the pattern on which the company is being activated as far as the solar cycle.

The period of the Sun in Aries is usually from March 20 through April 19, Taurus, April 20 through May 20; Gemini, May 21 through June 20; Cancer, June 21 through July 22; Leo, July 23 through August 22; Virgo. August 23 through September 22; Libra, September 23 through October 22: Scorpio, October 23 through November 21; Sagittarius, November 22 through December 21; Capricorn, December 22 through January 19; Aquarius, January 20 through February 15; and Pisces, February 19 through March 20. These are the twelve signs with the transit of the Sun.

Again, let me stress the importance of the aspect of the Sun during these periods. If it involves a combination that relates to panic, crashes, recession or depression, then these months will be more intensified as far as the effect. If the transit is in a trine or a good aspect then the movement will be fess severe than under normal conditions.

There is one more important point to the solar cycle which is really the result of another cycle. This is the 19-year cycle of the motion of the plane of the Moon's orbit. It is the solar eclipse cycle. Although there is partial or total eclipse each year. usually there will be an eclipse near the same degree of the zodiac once every 19 years. This is a major eclipse. This major eclipse does have an effect on changes within the stock market and these changes have been reflected year after year during these cycles. Since this eclipse involves the Moon, it represents changes in relation from a Moon-Sun characteristic.


In this cycle the Sun makes a complete circuit of the sky and reaches the same Node at the same place on the ecliptic as shown in diagram 3. This length of time is 6585.32] solar days, which is 48 years, 11.33 days. The shortest time required for the Sun to travel from and return to the same node is 346.6 solar days, an interval known as an eclipse year. It is listed on the calendar year because of the effect of the session which is known as a slow regression of the nodes around the ecliptic. Nineteen of the eclipse years contain 6585.4 days, which is precisely 223 synodic months, This is when the Nodes themselves become important in the predictions on the stock market.

The Moon affects changes and emotions. The daily influence on the stock market is related to changes of the Moon as it transits through each sign. Its effect on individual corporations would be the same. The Moon works in association with the planet Saturn. The Moon's phase cycle is from 28 to 29.5 days. Saturn’s cycle is 28 to 29,5 years, So, where it takes Saturn 2.5 years to transit one sign, it takes the Moon 2.5 days. If the Moon shows weakness in one sign as to where a stock would drop rapidly during that time, then when Saturn is also in the sign this would cause a 2.5 year downtrend for the stock. For example. if the Moon goes into Taurus and the stock goes up or down, it will do the same when Saturn is in that sign. So ever though a lot of aspects related to the Moon are minor, such as a stock might drop one-eighth to one-half, during its transit through any one sign, it does relate 10 a longer trend with the effects of Saturn.

In judging the daily influence of the Moon's dominance over a certain stock, bear in mind the influence of a transit of the Sun. If the Sun’s movement shows a high point for the Dow-Jones averages, then the Moon as a negative factor on the Dow-Jones will not have that much influence. If they are both at a high point, then the stock would rise extremely high on that day. So use the Moon as a daily indicator together with the 30-day movement of the Sun in each sign.

There are three cycles related to the Moon. One is called a Moon return. This cycle occurs every four years, when the Moon returns to the same position. (Check the four-year cycles day by day of a stock.) Another cycle is 27.5 days by the sign itself and 28 or 29.5 days by phase. These are the cycles represented by the Moon. The pattern of the four-year cycle is more dominant in a long-term trend relating to the stock market. The Moon also has a period in which it is stagnant, or void of course. 1t is a period when the Moon is changing from one sign to another without being aspected. From research this is not a period to purchase stock as it represents changes indicating a complete reverse. It is an unstable period of the Moon.

You can also determine monthly trends by watching the Moon under each cycle. In a period of 28-29.5 days, if the Moon falls square, conjunction, or opposite to planets passing over the Midheaven, this will give you an indication of good or bad returns following the week in relation to the stock market itself. It generally relates to people's emotions. The Moon's Nodes are also prominent indicators as far as the movement around the zodiac. If an individual stock has the Moon's North Node going toward the Midheaven, this indicates it will have movement. If it falls below the Ascendant, this generally causes it to move downwards. However, again, you have to use the other planetary movements to make a complete judgment. You cannot do it by the Nodes themselves, but the Nodes would reinforce any conditions shown as a downtrend in a certain stock.

The Moon and Sun in relation to each other show a type of speed that a certain cycle is indicated to move under because the effects of the Sun, the Moon and Earth are the prominent factors relating to the movement during the year, The other planets more or less determine tong-tern trends.

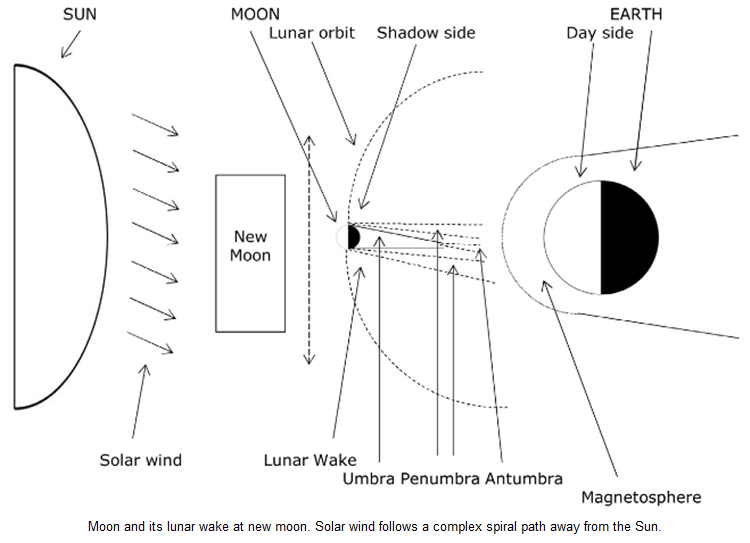
The speed of the Moon is affected by the tidal deformation of the Earth which produces a gradual increase on the Moon’s orbital speed which in turn makes the Moon slowly recede, causing a fast or a slow Moon which does reflect the aspects as far as movement of a cycle. IF it’s fast, there's a lot of action in the market, or if it's slow, then a change is predicted. In Diagram 4 we have a plain view of the Moon's orbit, We show that the Earth-Moon gravitational inter-reaction generates two bulges, more or less like a plastic bubble. The Earth has an axial rotation which is faster than the orbital rotation of the Moon, and the effect of this frictional drag is that the bulges arc carried around the Earth's rotation until a balance is established between the drag and the tide generating force.

The pattern of the four year cycle is more dominant in a long-term trend relating to the stock market. The Moon also has a period which is stagnant. This is called the Moon void of course. It is a period when the Moon is changing from one side to another without being aspected. This is not a period to purchase stock as it represents changes that could go completely reverse. It is an unstable period of the Moon itself.


In diagram 4 we have equilibrium point 1. This is nearer to the Moon than point 2, and is therefore experiencing a stronger gravitational attraction than 2. Both 1 and 2 are displaced from the central line so that the forces along with 1 and 3 and 2 and 3 converge toward the center of the Moon. These two forces may be resolved at the Moon into components that act, in one case, along the central line toward the Earth; and in the other case at right angle into the direction of the Moon's orbit. The components acting toward the century add together, whereas the components in direction of the orbit are in opposition. Because the force along 1 and 3 is larger than along 2 and 3, this means a net unbalance force acting on the Moon in the orbital direction, which has the effect of accelerating its motion, moving it into an orbit of a larger radius; modern estimates indicate a recessional speed of about 3.2 cm. per year.

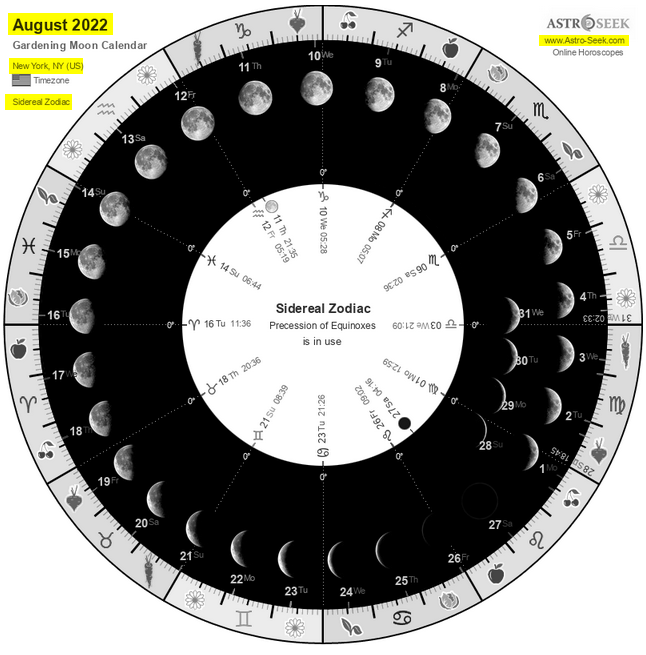
For accurate calculation, there are many Moon sign books and Moon calendars, that will give you the transit of the Moon each day, which you can relate to stock predictions. In the speed of a stock, we have the one-half cycle, the one-fourth, and the three-fourths, all of which indicate changes in relation to the up and down cycle price of each stock.

 
See also:
 

Saturday, July 30, 2022

Trading the S&P 500 with the Lunar Cycle | Randall Ashbourne

Randall Ashbourne (2011) - [...] stock prices tend to be higher around the time of the New Moon each month and reach a temporary low point around the time of the Full Moon. Now that’s statistically speaking. And there are Lies, Damned Lies - and Statistics! [...] Many of the Lunar trading articles found easily on the internet tend to suggest the potential gains are relatively minor, or that the phenomenon inverts so often that it can’t be used as a reliable trading technique.

[...] What I discovered was that, statistically, the old assertions not only hold up, but when traded consistently over time, produce big profits for small amounts of time exposed to market conditions [...] Buying a single share of the index at the closing price of our starting date on the January 4 New Moon and holding until the close of the June 1 Solar Eclipse New Moon, produced a profit of $44.35 - 3.49% (bottom left corner of the table).
 
 
However, going Long for one share from each Full Moon close to the next New Moon close, produced more than twice the profit - $90.96. So, we were in the market for half the time and twice the profit (the FM-NM green phase label).

[...] Staying OUT of the market during all New Moon-Full Moon phases would have protected us from losing some of our buy-and-hold gains … but delivered much better profits for our Loonytoons strategy by being profitable Short trades. We were in the market ALL the time, but continually reversing positions - to get three times the profit of buy-and-hold. The darker green coloring shows the very profitable trades, the light green shows profitable trades. The rose coloring shows that only ONE “assumed” Short phase would have resulted in a trading loss. But, remember … this is overall, taking into account the full 6 month period.

[...] take advantage of the Quarter Moon dates. So, our trading strategy now becomes to open 1 position at either the New Moon or Full Moon, but to add an extra position at the First Quarter or Third Quarter date. And the table below shows a significant boost to our potential profits: Instead of relying totally on the 14 day Short from NM-FM, we add one extra Short at the 1Q Moon - boosting the overall profit from Short trades from $46.61 to $109.36. And we adopt the same strategy when we reverse to Long trades at the Full Moon - 1 Long at Full Moon and one extra Long at 3Q Moon, boosting our Long profits to $152.56.
 

Taking advantage of the extra Long or Short position at the closing price on the day of the First Quarter or Third Quarter Moon dramatically increases the profits.
 

While the buy-and-hold strategy produced a profit of 3.5%, we could have made marginally more money by Shorting the index for a couple of weeks at each New Moon; twice as much money being exposed to the market for only half of each month from Full Moon to New - and almost six times as much money by playing the odds that the “statistics” will hold true when traded automatically, but consistently, over time.

The Lunar Cycle | Carol S. Mull

Carol S. Mull (198?) - The lunar cycle was first studied and presented to the faculty of the Graduate School of Pace University by Frank J. Guarino, in partial fulfillment of the requirements for the Master of Business Administration degree. Later, his thesis was published by the American Federation of Astrologers. Modern cyclists have carried Guarino's work much farther. Today, it is possible to predict the market with 70% accuracy using only the lunar cycle.
 

The Sun and the Moon are in square aspect (90°) during the first and last quarters, in opposition (180°) at the Full Moon, and in conjunction (0°) at the New Moon. They are in sextile (60°) between the New Moon and the first quarter and between the last quarter and the New Moon. For precise work, compute a heliocentric chart for the times that the Moon, Earth, and Sun are in exact aspect. Unless there are other overshadowing influences, trines (120°) and conjunctions will be up, squares will be down, oppositions will be somewhat up, and sextiles can be either direction.

Most financial astrologers will tell you that oppositions (Full Moons) will sent the market down, but my experience does not verify this. Apparently, the momentum of being between two trines will carry the opposition along. If the next aspect following a sextile is a conjunction, the sextile is likely to correlate with an upward movement. But if the aspect following a sextile is a square, the sextile is likely to be accompanied by a downward-moving market. 

Another lunar cycle concerns the elements. The market tends to move up whenever the Moon is in an Air [Gemini, Libra, Aquarius] or Fire sign [Aries, Leo, Sagittarius] and to move downward whenever the Moon is in an Earth [Taurus, Virgo, Capricorn] or Water sign [Cancer, Scorpio, Pisces]. Other recent experiments have attempted to be the Moon's velocity and the angular rates of positive acceleration or negative acceleration to the market. These have been inconclusive. 

 
References:
Carol S. Mull (1988) - Short-Term Market Forecasting via Astrology. In: Traders World, #4903, Issue #3.
Carol S. Mull (1989) - Mercury and the Dow. In: Traders World, #4915, Issue #15.
 
HERE
HERE

HERE

Tuesday, July 12, 2022

Playing the Field | Lunar Effects on Mood and Biology

Michael Bevington (2015) - The Earth’s magnetosphere is formed by the Sun’s wind passing the Earth. It surrounds the Earth but is much larger on whichever part forms its local ‘shadow’ or ‘night’ side, where it forms a tail, or magnetotail. The magnetotail extends over 6,300,000 km. 


[...] Every month, at full moon, the Moon crosses the magnetotail for 6–7 days at about 348,000 km from the Earth. As revealed by recent space exploration, when the Moon traverses the magnetotail’s electromagnetic plasma sheet, it attracts a large electrical charge, thus disturbing the plasma sheet. Ions from the Moon’s surface transfer to the Earth’s magnetosphere. This in turn can influence the Earth’s electric and magnetic field by a form of magnetospheric feedback, since the thin current sheet of the magnetotail has an earthward electric field.
 

[...] The Moon affects the Earth’s magnetosphere differently at new moon compared with full moon. At new moon, on the Sun’s side of the Earth, the Moon does not cross through the magnetosphere. Instead its lunar wake, formed from the solar wind, is blown downstream towards the Earth’s magnetosphere in a relatively narrow pathway, but in a varied way because of the Sun’s 11-year sun-spot cycle and the Sun’s rotating magnetic field. The latter has two effects. Firstly, Earth experiences reversed solar polarity when crossing sectors in the interplanetary magnetic field, typically twice in about 27 days. Secondly, the solar wind travels in a spiral, so the lunar wake is not usually in direct alignment from the Sun. The new moon effect from the lunar wake on the Earth’s magnetosphere can be considered comparable to magnetotail effects at full moon, with evidence of electric fields, and magnetic fluctuations of up to 5 Hz from the plasma of the penumbra surrounding the lunar wake."

The greatest change in the electric field potential occurs as the moon crosses into and out of the magnetotail plasma, which occurs 2-3 days before the full moon and 3-4 days after the full moon.

Some of the reported effects of the full moon on animal and plant biology: tree diameter variation reflects a lunar rhythm; reproduction; changes in the stress hormone; epileptic seizures and unexpected deaths increase during full moon; increase of violent and acute behavioral disturbances during full moon, etc.

References:

Tuesday, November 30, 2021

Geocentric and Heliocentric Bradley Indices │ Turning Points 2022


 2021 Dec 10 (Fri) = Low (geo) + High (helio)
2021 Dec 20 (Mon) = Low (helio)
2021 Dec 24 (Fri) = High (geo)
2021 Dec 31 (Fri) = Major High (helio)
2022 Jan 06 (Thu) = Low (helio)
2022 Jan 10 (Mon) = High (helio)
2022 Jan 16 (Sun) = Major Low (geo) +  Low (helio)
2022 Jan 19 (Wed) = High (helio)
2022 Jan 30 (Sun) = Major Low (helio)
2022 Feb 07 (Mon) = High (helio)
2022 Feb 11 (Fri) = Low (helio)
2022 Feb 12 (Sat) = High (geo)

2022 Feb 20 (Sun) = High (helio)
2022 Feb 26 (Sat) = Low (geo)
2022 Mar 04 (Fri) = Low (helio)
2022 Mar 06 (Sun) = High (geo)

2022 Mar 10 (Thu) = Low (geo)+ High (helio)
2022 Mar 18 (Fri) = Low (helio)
2022 Mar 20 (Sun) = Major High (geo)

2022 Mar 28 (Mon) = Major High (helio)
2022 Mar 29 (Tue) = Major Low (geo)

2022 Apr 04 (Mon) = Low (helio)
2022 Apr 08 (Fri) = High (helio)
2022 Apr 13 (Wed) = Low (helio)
2022 Apr 17 (Sun) = High (helio)
2022 Apr 20 (Wed) = Low (helio)
2022 Apr 27 (Wed) = High (helio)
2022 Apr 28 (Thu) = High (geo)

2022 May 10 (Tue) = Low (geo)
2022 May 14 (Sat) = Major Low (helio)
2022 May 20 (Fri) = Major High (geo) +  High (helio)
2022 May 28 (Sat) = Low (helio)

2022 Jun 02 (Thu) = Low (geo)
2022 Jun 07 (Tue) = High (helio)
2022 Jun 16 (Thu) = High (geo) + Low (helio)
2022 Jun 24 (Fri) = High (helio)
2022 Jun 28 (Tue) = Low (helio)
2022 Jul 05 (Tue) = High (helio)
2022 Jul 06 (Wed) = Low (geo)

2022 Jul 10 (Sun) = Low (helio)
2022 Jul 13 (Wed) = High (geo)
2022 Jul 15 (Fri) = Major High (helio)
2022 Jul 27 (Wed) = Major Low (geo)
2022 Jul 28 (Thu) = Low (helio)

2022 Aug 01 (Mon) = High (helio)
2022 Aug 04 (Thu) = High (geo)
2022 Aug 09 (Tue) = Low (geo)
2022 Aug 11 (Thu) = Major Low (helio)
2022 Aug 18 (Thu) = Major High (geo)
2022 Aug 22 (Mon) = High (helio)
2022 Aug 27 (Sat) = Low (helio)
2022 Aug 28 (Sun) = Low (geo)

2022 Sep 01 (Thu) = High (helio)
2022 Sep 11 (Sun) = Low (helio)
2022 Sep 12 (Mon) = High (geo)

2022 Sep 18 (Sun) = Low (geo)
2022 Sep 21 (Wed) = Major High (helio)
2022 Sep 22 (Thu) = High (geo)
2022 Sep 28 (Wed) = Low (helio)
2022 Oct 01 (Sat) = Low (geo)
2022 Oct 03 (Mon) = High (helio)

2022 Oct 08 (Sat) = Major Low (helio)
2022 Oct 12 (Wed) = High (geo)
2022 Oct 13 (Thu) = High (helio)
2022 Oct 16 (Sun) = Low (helio)
2022 Oct 17 (Mon) = Low (geo)

2022 Oct 18 (Tue) = High (geo)
2022 Oct 22 (Sat) = High (helio)
2022 Oct 27 (Thu) = Low (helio)
2022 Oct 30 (Sun) = High (helio)
2022 Nov 04 (Fri) = Major Low (geo)
2022 Nov 05 (Sat) = Low (helio)

2022 Nov 15 (Tue) = Major High (geo)
2022 Nov 16 (Wed) = Major High (helio)
2022 Nov 26 (Sat) = Low (helio)
2022 Nov 29 (Tue) = High (helio)
2022 Dec 03 (Sat) = Low (helio)
2022 Dec 04 (Sun) = Major Low (geo)

2022 Dec 07 (Wed) = High (helio)
2022 Dec 10 (Sat) = Low (helio)
2022 Dec 19 (Mon) = High (helio)
2022 Dec 30 (Fri) = Major Low (helio)
2023 Jan 05 (Thu) = Major High (geo)
2023 Jan 17 (Tue) = Major Low (geo)


[calculated for New York City: EST / EDT │ Geo-Helio-Clusters]

Some background on the Bradley Indices
and previous turning points HERE

Wednesday, December 2, 2020

Geocentric and Heliocentric Bradley Indices │ Turning Points 2021

 
2020 Nov 30 (Mon) = Low (helio)
2020 Dec 06 (Sun) = High (helio)
2020 Dec 17 (Thu) = Low (helio)
2021 Jan 01 (Fri) = High (helio)
2021 Jan 09 (Sat) = Low (geo + helio)
2021 Jan 13 (Wed) = High (helio)
2021 Jan 20 (Wed) = Low (helio)
2021 Jan 26 (Tue) = High (helio)
2021 Jan 28 (Thu) = Low (helio)
2021 Feb 01 (Mon) = High (helio)
2021 Feb 04 (Thu) = Low (helio)
2021 Feb 08 (Mon) = High (helio)
2021 Feb 14 (Sun) = Low (helio)
2021 Feb 19 (Fri) = High (helio)
2021 Feb 27 (Sat) = Low (helio)
2021 Mar 04 (Thu) = High (helio)
2021 Mar 15-16 (Mon-Tue) = Low (helio + geo)
2021 Mar 20-21 (Sat-Sun) = Low + High (geo + helio)
2021 Mar 28 (Sun) = Low (helio)
2021 Apr 01 (Thu) = High (geo + helio)
2021 Apr 07 (Wed) = Low (helio)
2021 Apr 09 (Fri) = Low (geo)
2021 Apr 11 (Sun) = High (helio)
2021 Apr 18 (Sun) = High (geo + helio)
2021 Apr 23 (Fri) = High (helio)
2021 Apr 25 (Sun) = Low (geo)
2021 Apr 27 (Tue) = Low (helio)
2021 Apr 29-30 (Thu-Fri) = High (geo + helio)
2021 May 04 (Tue) = Low (geo + helio)
2021 May 14 (Fri) = High (geo)
2021 May 18 (Tue) = High (helio)
2021 May 26-27 (Wed-Thu) = Low (geo + helio)
2021 Jun 02-04 (Wed-Fri) = High (helio + geo)
2021 Jun 14 (Mon) = Low (helio)
2021 Jun 19 (Sat) = High (helio)
2021 Jun 24 (Thu) = Low (helio)
2021 Jul 06 (Tue) = Low-High (geo + helio)
2021 Jul 14-15 (Wed-Thu) = Low-High (helio + geo)
2021 Jul 18 (Sun) = High (helio)
2021 Jul 25-27 (Sun-Tue) = Low-High (helio + geo)
2021 Jul 31 - Aug 02 (Sat-Mon) = Low (helio + geo)
2021 Aug 07 (Sat) = High (geo)
2021 Aug 11 (Wed) = Low (geo)
2021 Aug 14 (Sat) = High (helio)
2021 Aug 20-22 (Fri-Sun) = High-Low (geo + helio)
2021 Aug 25 (Wed-Fri) = Low-High (geo + helio)
2021 Aug 31 (Tue) = High (geo)
2021 Sep 04 (Sat) = Low (helio)
2021 Sep 16-18 (Thu-Sat) = High-Low (helio + geo)
2021 Sep 29 (Wed) = High (geo)
2021 Oct 01-03 (Fri-Sun) = Low-High (helio)
2021 Oct 09 (Sat) = Low (geo)
2021 Oct 12 (Tue) = High (geo)
2021 Oct 13-14 (Wed-Thu) = Low-High (helio)
2021 Oct 16 (Sat) = Low (helio)
2021 Oct 22 (Fri) = High (helio)
2021 Oct 27 (Wed) = Low (helio)
2021 Oct 30 (Sat) = High (helio)
2021 Nov 06-07 (Sat-Sun) = Low (helio + geo)
2021 Nov 10 (Wed) = High (helio)
2021 Nov 19 (Fri) = Low (helio)
2021 Nov 23 (Tue) = High (helio)
2021 Nov 27-28 (Sat-Sun) = Low-High (helio + geo)
2021 Dec 10 (Fri) = Low-High (geo + helio)
2021 Dec 20 (Mon) = Low (helio)
2021 Dec 24 (Fri) = High (geo)
2021 Dec 31 (Fri) = High (helio)
2022 Jan 06 (Thu) = Low (helio)
2022 Jan 10 (Mon) = High (helio)
2022 Jan 16 (Sun) = Low (geo + helio)
2022 Jan 19 (Wed) = High (helio)
2022 Jan 30 (Sun) = Low (helio)

[calculated for New York City]

Some background on the Bradley Indices
and previous turning points HERE

SoLunar Map | December 2020 - January 2021

Recent and upcoming SoLunar Turn-Days: Nov 30 (Mon), Dec 03 (Thu), Dec 07 (Mon), Dec 11 (Fri),
Dec 15 (Tue), Dec 18 (Fri), Dec 22 (Tue), Dec 26 (Sat), Dec 30 (Wed), Jan 02 (Sat), Jan 06 (Wed),
Jan 09 (Sat), Jan 13 (Wed), Jan 17 (Sun), Jan 21 (Thu), Jan 24 (Sun), Jan 28 (Thu), Feb 01 (Mon),
Feb 04 (Thu). Previous SoLunar Maps HERE

Cosmic Cluster Days | December 2020 - January 2021

Recent and upcoming Cosmic Cluster Days: Nov 16 (Mon), Nov 18 (Wed), Dec 05 (Sat), Dec 31 (Thu),
Jan 14 (Thu), Jan 22 (Fri), Feb 01 (Mon), Feb 08 (Mon). Previous CCDs are HERE

Saturday, October 31, 2020

SoLunar Map | Review and Preview for November 2020

SoLunar Map | Review and Preview for November 2020
Upcoming solunar turn-days: Oct 31 (Sat) = Full Moon, Nov 01 (Sun), Nov 04 (Wed),
Nov 08 (Sun), Nov 11 (Wed), Nov 15 (Sun), Nov 19 (Thu), Nov 22 (Sun), Nov 26 (Thu),
Nov 30 (Mon) = Full Moon, Dec 03 (Thu), Dec 07 (Mon). Previous SoLunar Maps HERE

Sunday, September 27, 2020

Cosmic Cluster Days | October - November 2020

Upcoming Cosmic Cluster Days: Oct 01-02 (Thu-Fri), Oct 12 (Mon), Oct 16 (Fri), Oct 21 (Wed),
Oct 23 (Fri), Oct 26 (Mon), Oct 28 (Wed), Oct 30 (Fri), Nov 03 (Tue), Nov 12 (Thu),
Nov 15-16 (Sun-Mon), Nov 18 (Wed).
Previous CCDs HERE

SoLunar Map | October - November 2020

Upcoming SoLunar Turn-Days:
Sep 24 (Thu), Sep 28 (Mon), Oct 01 (Thu), Oct 05 (Mon), Oct 09 (Fri), Oct 13 (Tue),
Oct 17 (Sat), Oct 20 (Tue), Oct 24 (Sat), Oct 28 (Wed), Nov 01 (Sun), Nov 04 (Wed),
Nov 08 (Sun), Nov 11 (Wed), Nov 15 (Sun), Nov 19 (Thu), Nov 22 (Sun), Nov 26 (Thu),
Nov 30 (Mon), Dec 03 (Thu). Previous SoLunar Maps HERE